
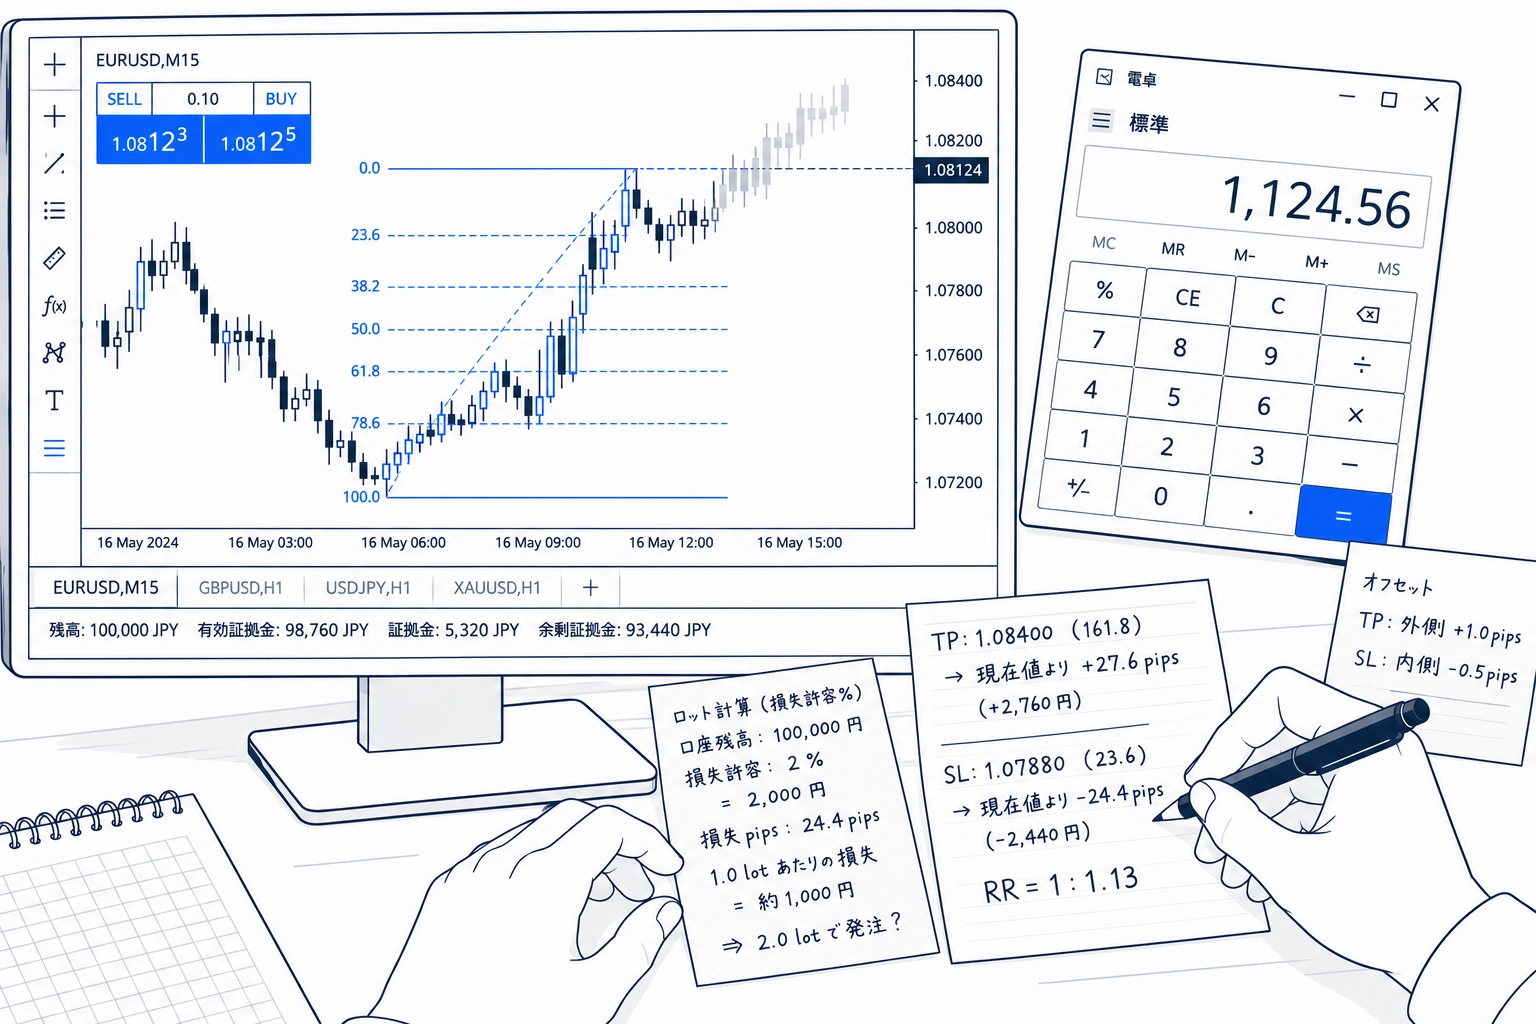
[Fibonacci Practical Notes] Episode 3: It is said that 61.8% is the final line of defense, but what is the reality?
It's a waste just to look for areas where prices may rebound
Last time I wrote where numbers like 23.6% and 61.8% come from. This time, I’ll talk about what each of those numbers actually means.
When you draw Fibonacci levels, several lines appear. In many explanations, it’s said that “this area tends to rebound.” However, in reality each of the five lines has its own face.
23.6% — shallow, so it feels uncertain
It is the shallowest level. It’s often said that a strong trend rebounds here and continues to extend. There are still many buyers remaining. That is the reading.
However, 23.6% isn’t heavily relied upon by itself. I’ve also expected a rebound based only on 23.6%, and been disappointed. Price ranges that have rebounded in the past, and moving averages. Only when these other turning points overlap does it become consciously observed. In practical use, it’s closer to that.
38.2% — the place where latecomers come in
It’s a level deeper than 23.6%. Some people couldn’t ride the initial move. They wait for a price that isn’t unrealistic and enter. That’s how this area is often described.
The depth of a strong trend’s correction up to this point is the guideline. It’s often considered healthy. Therefore, it’s among the first levels named as a typical area to buy on dips.
50% — actually not a Fibonacci level
Surprisingly, not well known. 50% isn’t a ratio coming from the Fibonacci sequence. 23.6%, 38.2%, 61.8%, 78.6% come from dividing terms of the sequence. But 50% is not included there.
It often retraces to halfway. It’s a market rule of thumb that buyers and sellers are evenly balanced at that turning point. It seems this was later added to Fibonacci lines. In other words, numbers with different origins line up on the same chart.
61.8% — the most talked-about level
It is the golden ratio itself. “If you stay above here, the original trend continues.” “If you break this, the price may return to the starting point of the trend.” This is the most prominent level among Fibonacci levels.
One more thing to mention here. Some voices doubt whether 61.8% is truly such a strong turning point. I’ve also once overtrusted 61.8% and paid the price. Expecting a rebound too much, it broke through instead.“Levels that are said to work well” and “levels that actually work well” are not always the sameIt seems. It’s just a guideline. It’s reasonable to view it as a level many traders are conscious of, to a certain extent.
78.6% — stop or end
The deepest level. If there is a 100 pips rise and price retraces to 78.6%, only 21.4 pips remain. Eighty percent of the rise has vanished in the retracement.
If price stops here, you can say it was a deep pullback. However, if it breaks, the view shifts to “the ascent is over.” It’s considered a pivotal level.
In harmonic patterns, this depth itself is often targeted. Because its frequency is low, its appearance carries a lot of meaning. That’s how I view this level.
Each has a different meaning, but Fibonacci alone doesn’t move the market
We have looked at these five levels up to here. Side by side, the shallower levels indicate trend strength, and the deeper levels indicate the possibility of a reversal. A clear axis emerges, doesn’t it?
But one important thing remains.The Fibonacci lines themselves do not move the market.Many people look at the same lines, so it appears to work. As I wrote last time, that’s the nature of this type of indicator.
That doesn’t mean you don’t need to know what each level means. On the contrary, knowing the meaning of the lines becomes additional decision material. “This time it rebounded shallowly. It might be a strong trend.” That is how you can read it.
Introduction to my preferred tool
The FTS I use displays the drawn Fibonacci levels with price, and shows at what pips each level will reach, at the moment you draw the lines.
Because you can freely configure the levels displayed, you can customize them to fit the market, and they pair very well with other indicators and Dow Theory, etc.
The ease of analysis when combining Fibonacci with other indicators and Dow Theory, and the efficiency of trading, have improved dramatically.
Details of actual screens and features are on the product page.
→Fibonacci Trade System (product page)
Next time
In Part 4,which highs and which lows we draw fromI will write.
This time was about the meaning of each level, but if the starting point is different, the positions of all levels shift. When I actually calculated it, moving the starting point by one level made 61.8% move by more than 12 pips. This part is surprisingly not often discussed, yet the outcomes change significantly.