

[30-day free version coming soon] Latest COT analysis — Large speculators remain overly bullish on the dollar, EUR and GBP continue to be oversold
Will the excessive positioning of large speculative traders really revert?
CFTC publishesCOT (Commitments of Traders) as actual data, and we interpret it to explain “Large Speculators COT Reversion Signal, what logic generated the signal and what resultswere obtained, and this week’s latest COTup to this point.
① Last week’s COT report (raw data)
COT (Commitments of Traders)is the open interest in futures published byCFTCevery Friday. The table below showsas of August 4, 2026 (announcement on August 7),the net positions of large speculators (Non-Commercial).
| Currency | Longs | Shorts | Net | Net %OI |
|---|---|---|---|---|
| EUR | 201,847 | 259,938 | −58,091 | −7.3% |
| GBP | 55,012 | 112,826 | −57,814 | −23.4% |
| CAD | 13,514 | 192,609 | −179,095 | −49.1% |
| JPY | 147,228 | 192,701 | −45,473 | −10.8% |
| AUD | 74,385 | 107,575 | −33,190 | −13.8% |
| CHF | 11,270 | 44,092 | −32,822 | −30.0% |
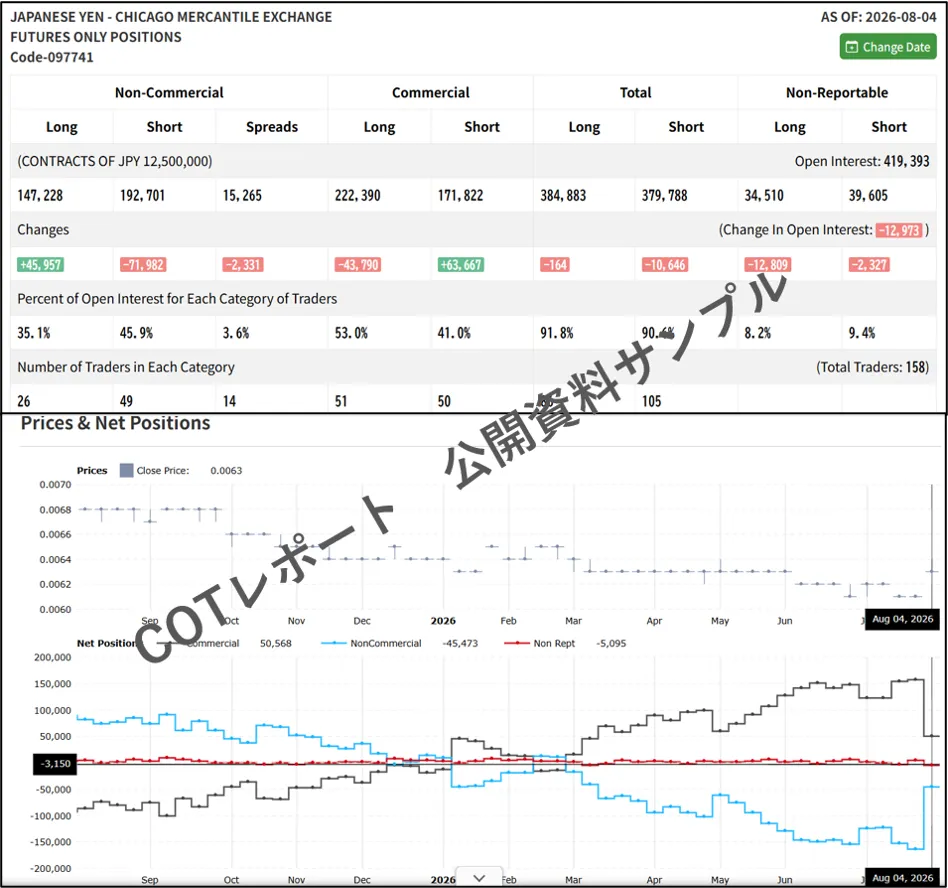 ★Image 01: Original COT report published by CFTC (e.g., Japanese Yen)
Summary:Last week, large speculators werenet sellers against USD across all 6 currencies— in other words, they tilted toward buying dollars. Among them,CAD stood out (net around −180,000 contracts, %OI −49%). This “excessive tilt” is the starting point for the signals introduced next.
② How the tool signalizes this raw data
The key is not to use the magnitude of %OI as is.This tool quantifies each currency’s position by a z-score in comparison to its own ~3-year historical average, turning it into a numerical value.
・CADappears as the largest net seller with %OI −49%,but CAD tends to be sold ordinarily,soz −1.03=“slightly excessive”.
・ConverselyEURlooks small with %OI −7.3%, and it is rare for EUR to be sold this much.z −1.77=historical overextension。
→“magnitude” is not the focus; it’s the currency’s anomaly (z)that matters for this tool’s perspective.
And|z|>1.0 (extreme)currencies are signaled to move toward equilibrium. Currencies that have been oversold by large speculators arelikely to be bought back (revert)— that is the idea.
| Currency | Net %OI | z | Judgment |
|---|---|---|---|
| EUR | −7.3% | −1.77 | Buy EURUSD (oversold → revert) |
| GBP | −23.4% | −1.35 | Buy GBPUSD (oversold → revert) |
| CAD | −49.1% | −1.03 | Sell USDCAD (CAD oversold → revert) |
| JPY | −10.8% | −0.09 | Wait and see (|z|≦1.0) |
| AUD | −13.8% | +0.32 | Wait |
| CHF | −30.0% | +0.38 | Wait |
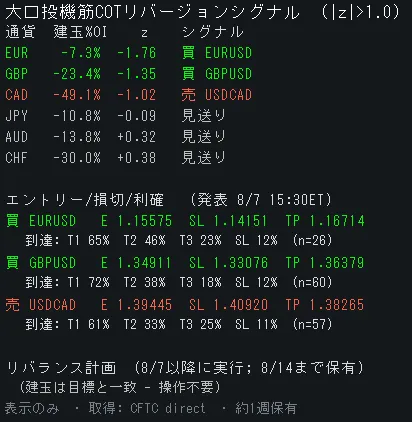 ★Image 02: Tool panel (currency table, z, signals, entry/stop/exit)
③ Result: What happened to last week’s 3 signals?
Enter after announcement and close on the following week’s review—all three signals closed in profit direction (amounts from different operators vary, shown as gained pips).
| Currency pair | Direction | Entry → Exit | Gain |
|---|---|---|---|
| USDCAD | Sell | 1.39370 → 1.38650 | +72 pips |
| EURUSD | Buy | 1.15439 → 1.15788 | +35 pips |
| GBPUSD | Buy | 1.35094 → 1.35516 | +42 pips |
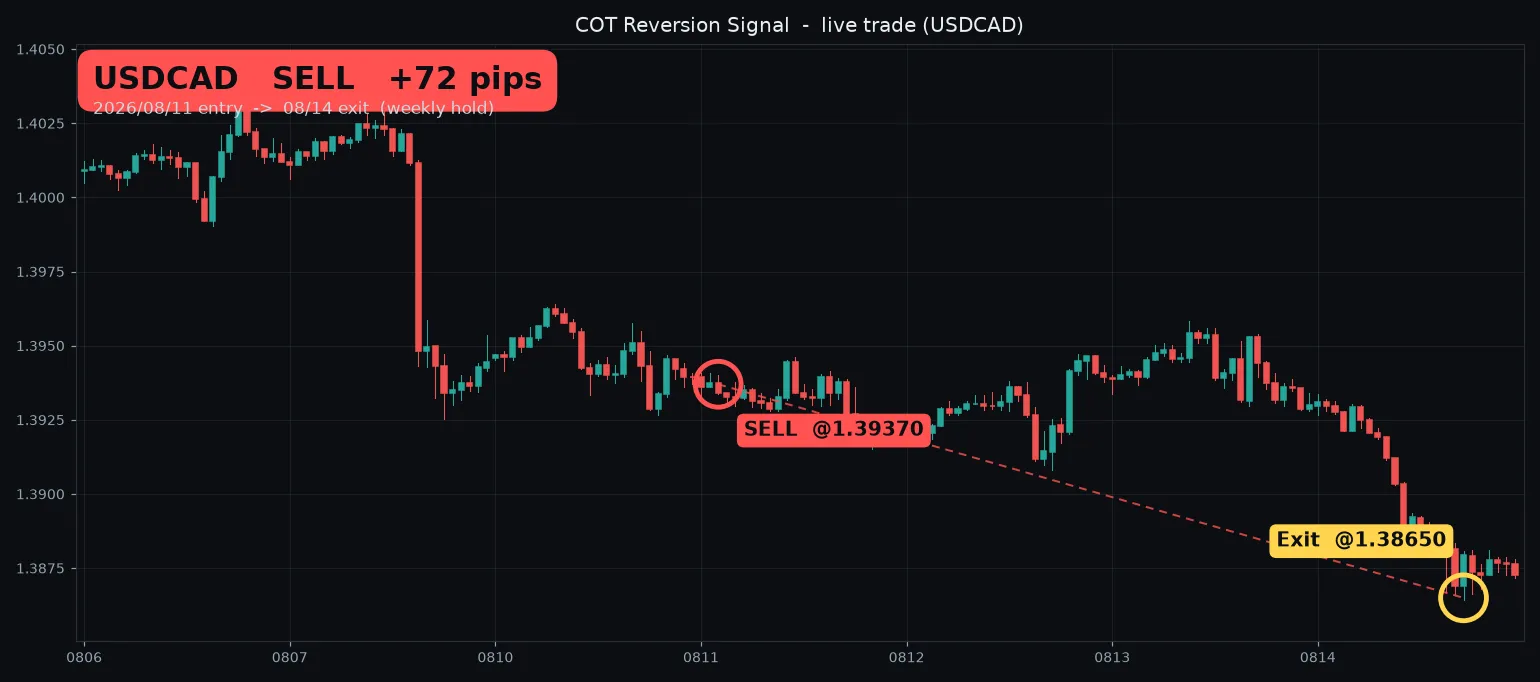 ★Image 03: USDCAD Sell (+72 pips, TP reached)
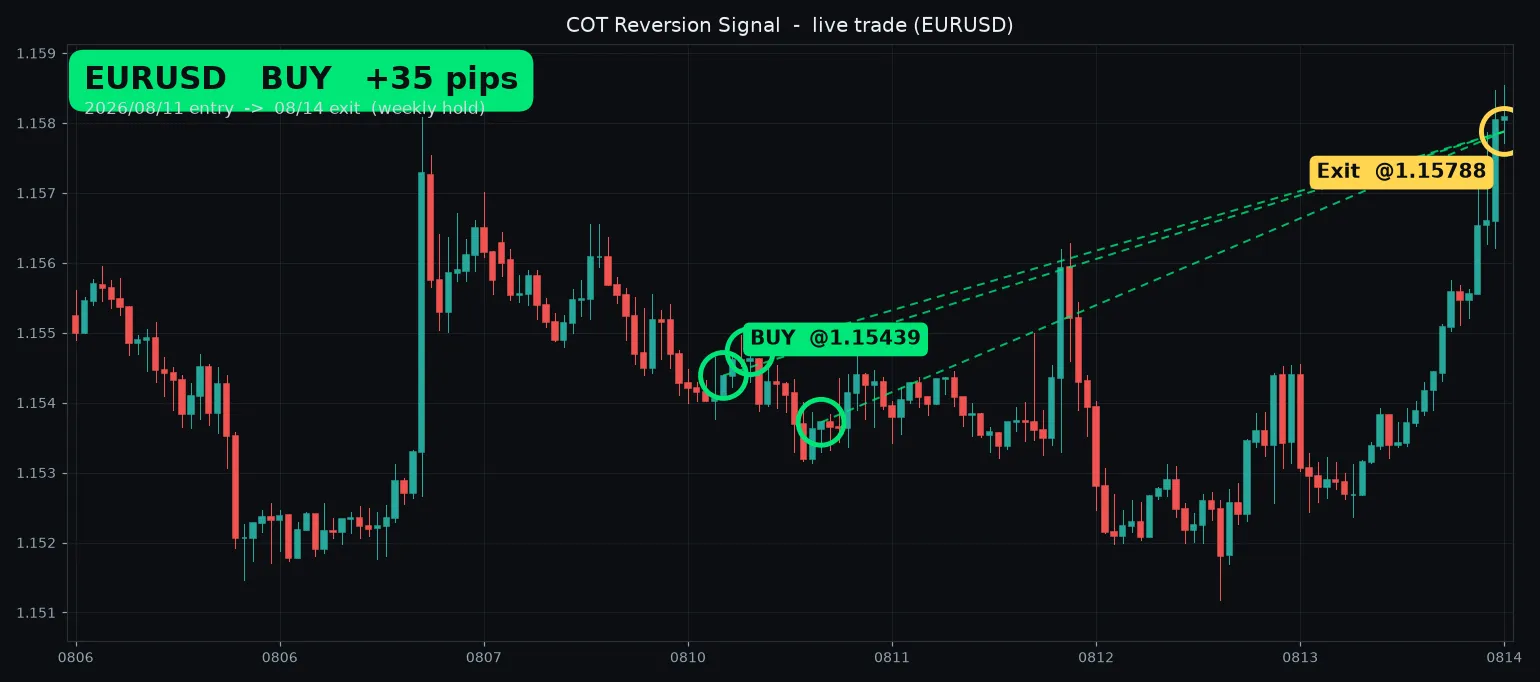 ★Image 04: EURUSD Buy (+35 pips, pullback portion)
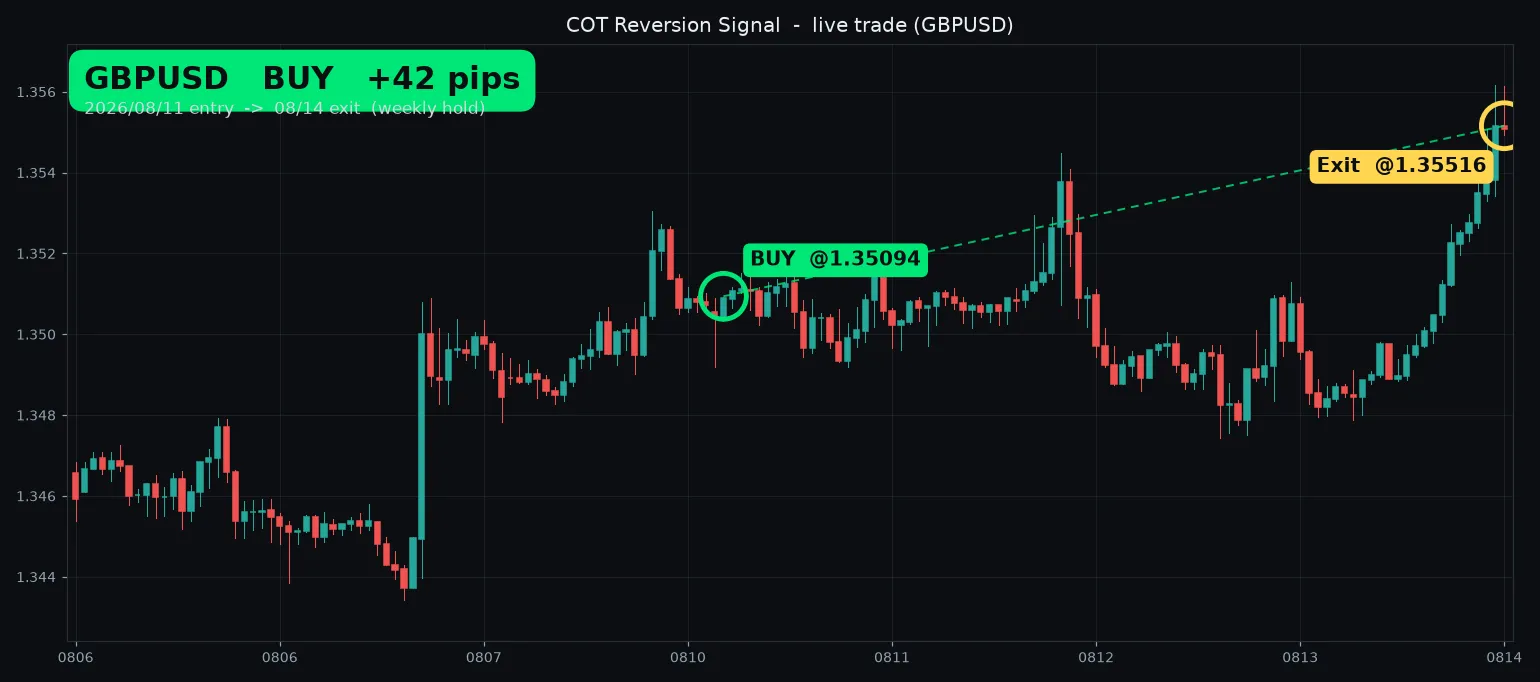 ★Image 05: GBPUSD Buy (+42 pips)
※This is a real sample from the second week of August 2026. Results cover one week and 3 signals only; they do not guarantee future performance. Currencies not triggering exits are not included. Amounts and account balance are not reflected; gains shown in pips.
④ And this week’s latest COT (announced August 14)
The latest iteration (as of August 11, 2026) shows the positioning of large speculators and the tool’s determination.
| Currency | Net %OI | z | Judgment |
|---|---|---|---|
| EUR | −7.5% | −1.77 | Buy EURUSD (continue) |
| GBP | −21.9% | −1.26 | Buy GBPUSD (continue) |
| CAD | −47.6% | −0.93 | Wait toward reversal (from extreme zone) |
| JPY | −10.7% | −0.09 | Wait |
| AUD | −14.7% | +0.28 | Wait |
| CHF | −29.5% | +0.44 | Wait |
Last week, CAD showed extreme selling by large speculators (z −1.03) → tool suggested “sell USDCAD” → +72 pips. And this week, CAD’s tilt moved to z −0.93, exiting the extreme zone“Wait”. This is a concreteexample of overextension → reversionthat occurred. Meanwhile, EUR and GBP remain oversold,signal to buy continues.
Of course, one week is a short sample. Therefore this tool also offers to display the achievement rate to each take-profit line (T1/T2/T3), and a setting to plot past signals on the chart. It enables you to verify trends over a longer period with your own eyes.
Entry/Stop/Take targets andachievement rate- weeklyrebalancing plan, a complete panel, andweekly updates from next week onwardare—
▼ First30-day free trialto try on your own screen.
※COT figures are based on CFTC published data (as of August 4 and August 11, 2026). The performance shown is from a real-week sample (1 week, 3 signals) and does not guarantee future results. Losses may occur due to market movement.
※Final investment decisions should be made at your own responsibility. Prices, specifications, release timing, and trial terms are subject to change without notice. Copyright (c) 2026 TriParity Labs - K.Yamamoto