
[FX Method Verification] Why do markets move at the “recent high/low” and “round numbers”? The true nature of “order concentration” that creates breaks and rebounds
━━━━━━━━━━━━━━━━━━
Introduction to Okutore Logic Trainer
━━━━━━━━━━━━━━━━━━
An EA for discretionary trading usable on MT4.
・Practice Mode:Repeated entry and exit practice while replaying past charts
・Real Trading Mode:Trade management via chart buttons (supports real trading)
▼Details
When you trade FX, you will encounter many puzzling moments.
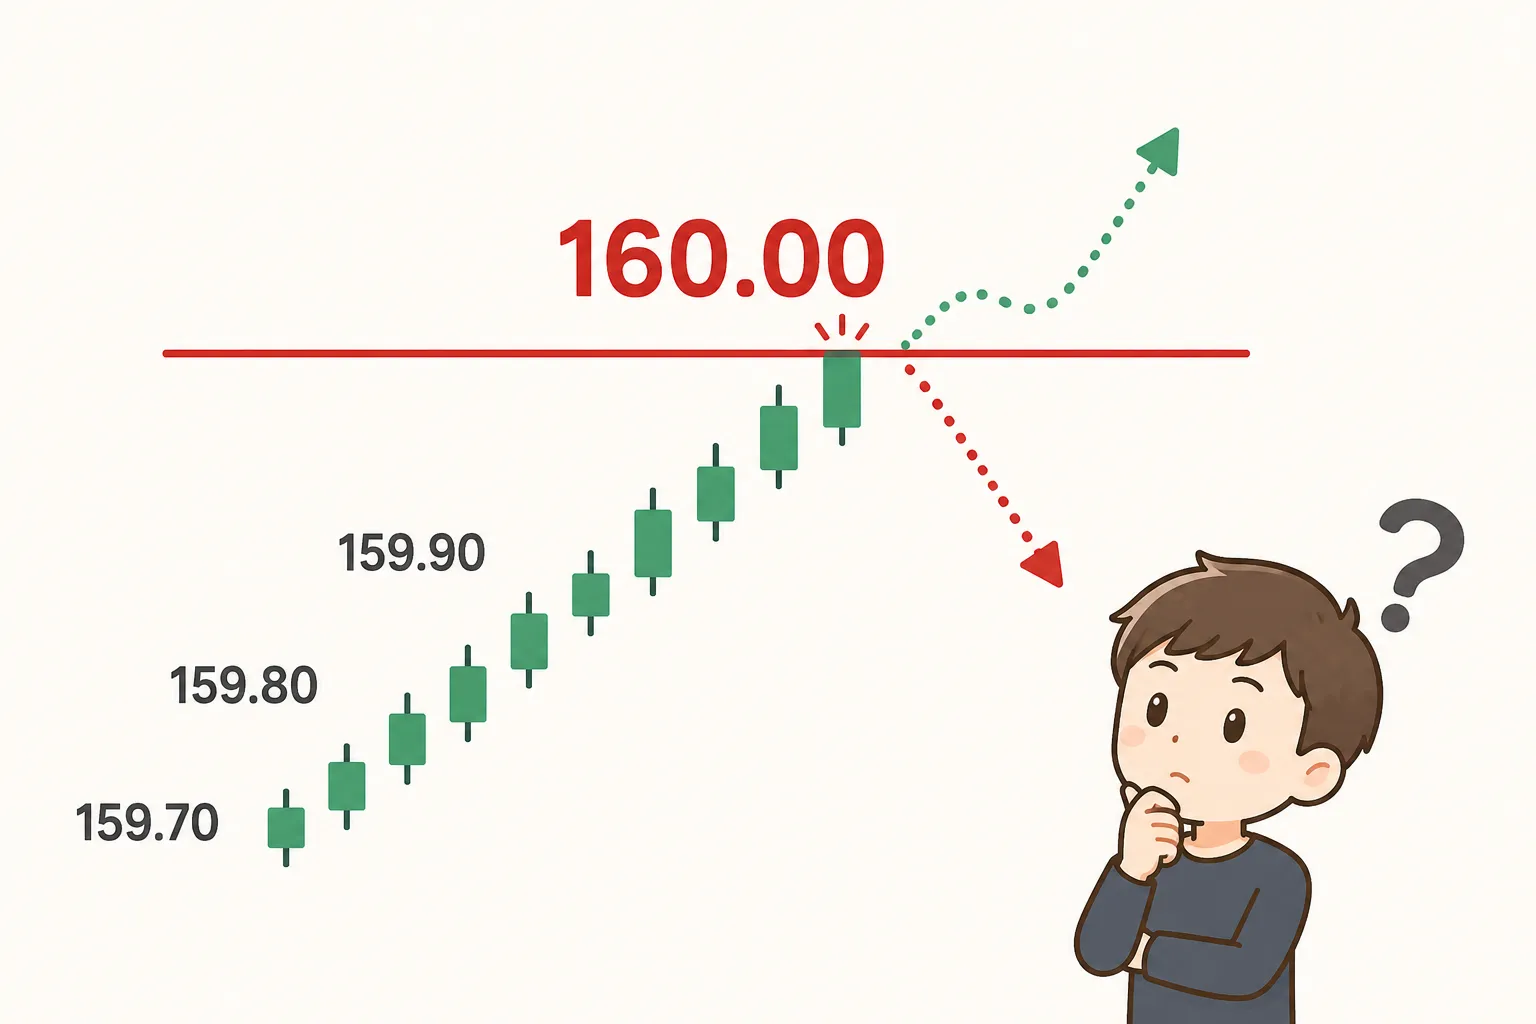
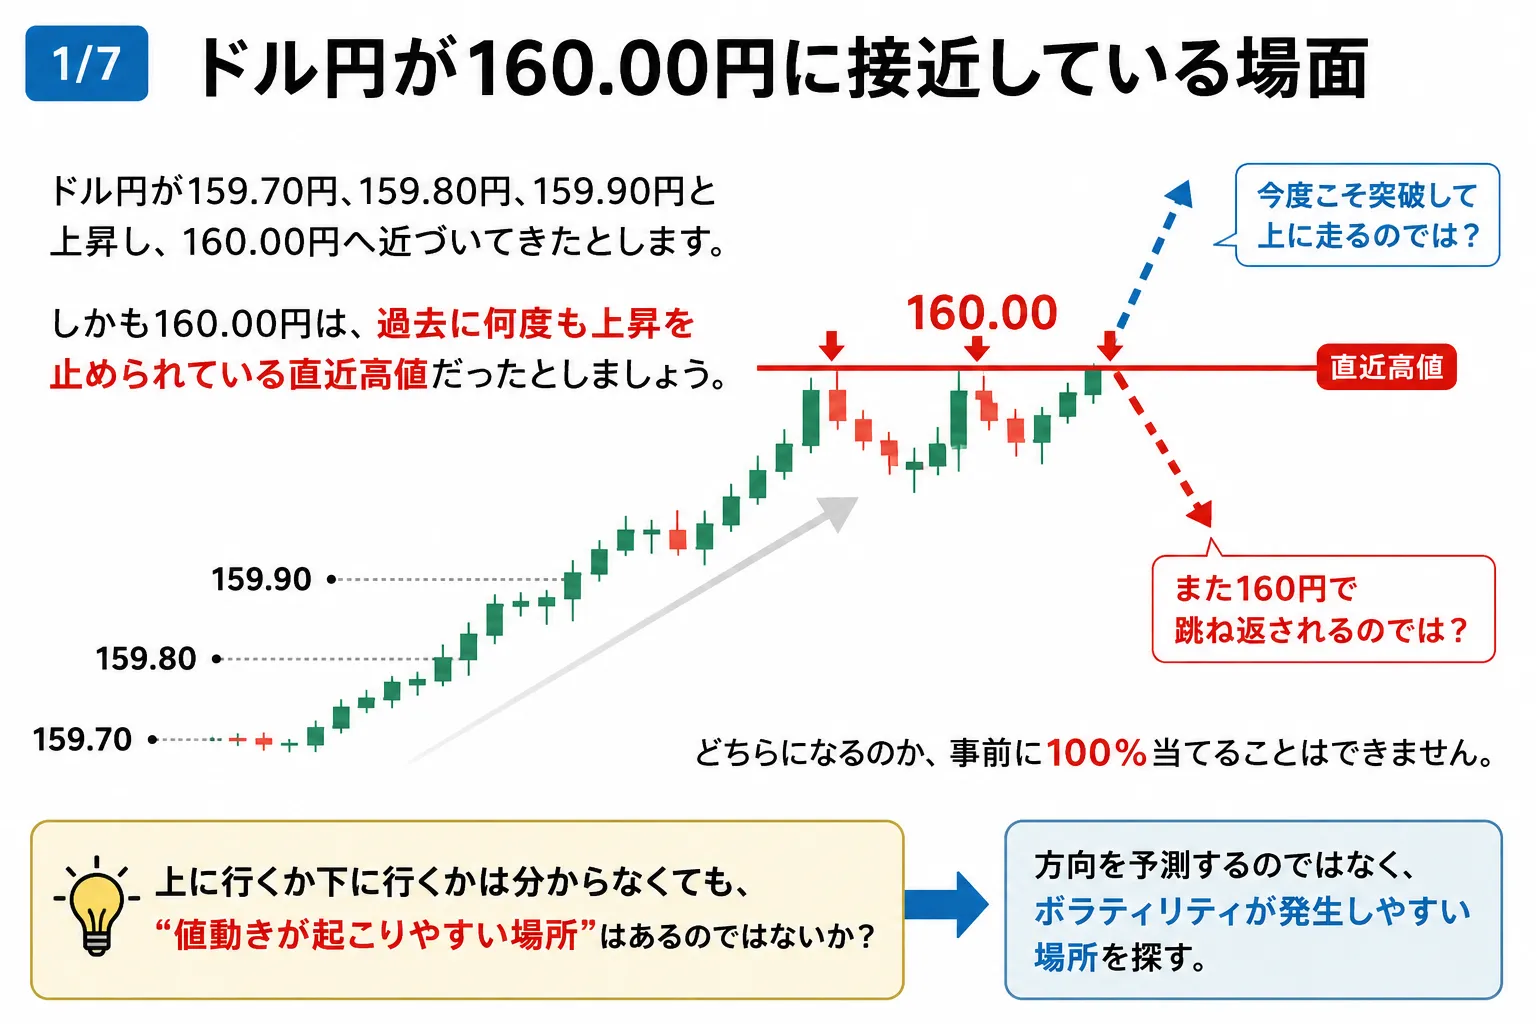
For example, USD/JPY rises to 159.70, 159.80, 159.90, and approaches 160.00.
Moreover, 160.00 has been a recent high that prevented advances several times in the past.
In such situations, some may think,
"Will it bounce at 160 again?"
and others may think,
"This time it will break through 160 and run higher in one swift move?"
In reality, you cannot predict which outcome will occur with 100% accuracy in advance.
However, I believe there is one important point here.
Even if you don’t know whether it will go up or down, isn’t there a place where price movement tends to occur?
In other words,
Instead of predicting direction, look for areas where volatility is likely to occur.
That is the idea.
This time, I want to consider why near-term highs/lows, support/resistance, and round numbers like 160.00 tend to make price move more easily.
I’ll also introduce studies analyzing actual FX order data and discuss from the perspectives of scalping, day trading, and swing trading.
Highs and lows are not just lines on a chart
When you look at a chart, many traders draw horizontal lines at similar levels.
For example,
- Recent high
- Recent low
- Previous day high/low
- Prices that have repeatedly rebounded
- Round numbers like 160.00, 150.00
- Round numbers like EUR/USD 1.1000
These are the kinds of prices people look at.
Why do so many people focus on the same levels?
One simple reason is that
"Many market participants make trading decisions based on those levels"
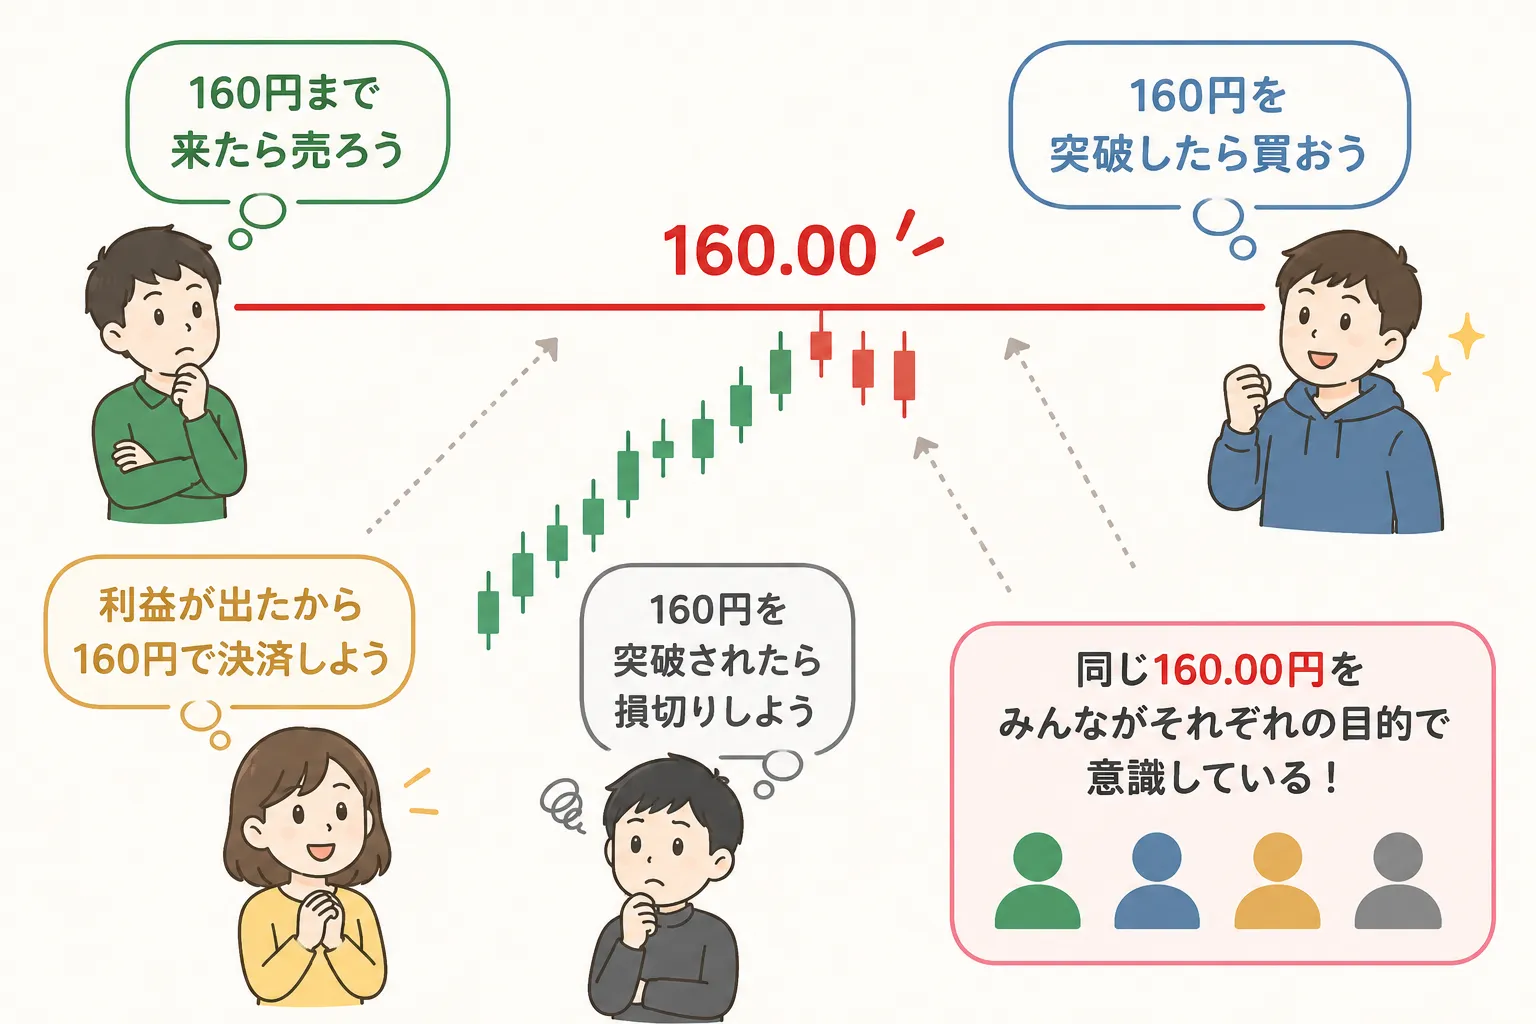
So if price has been stopped at 160.00 many times,
there will be people who think,
"If price reaches 160, I’ll sell."
On the other hand,
"If price clearly breaks 160, I’ll buy."
There are also people who are short around 160 and may think,
"If price clearly breaks 160, I’ll cut losses.
In other words, at the same price of 160.00, there are buyers, sellers, and those taking profits or stops all watching.
This is extremely important.
There are studies that have examined actual FX orders
There are very interesting studies on this phenomenon.
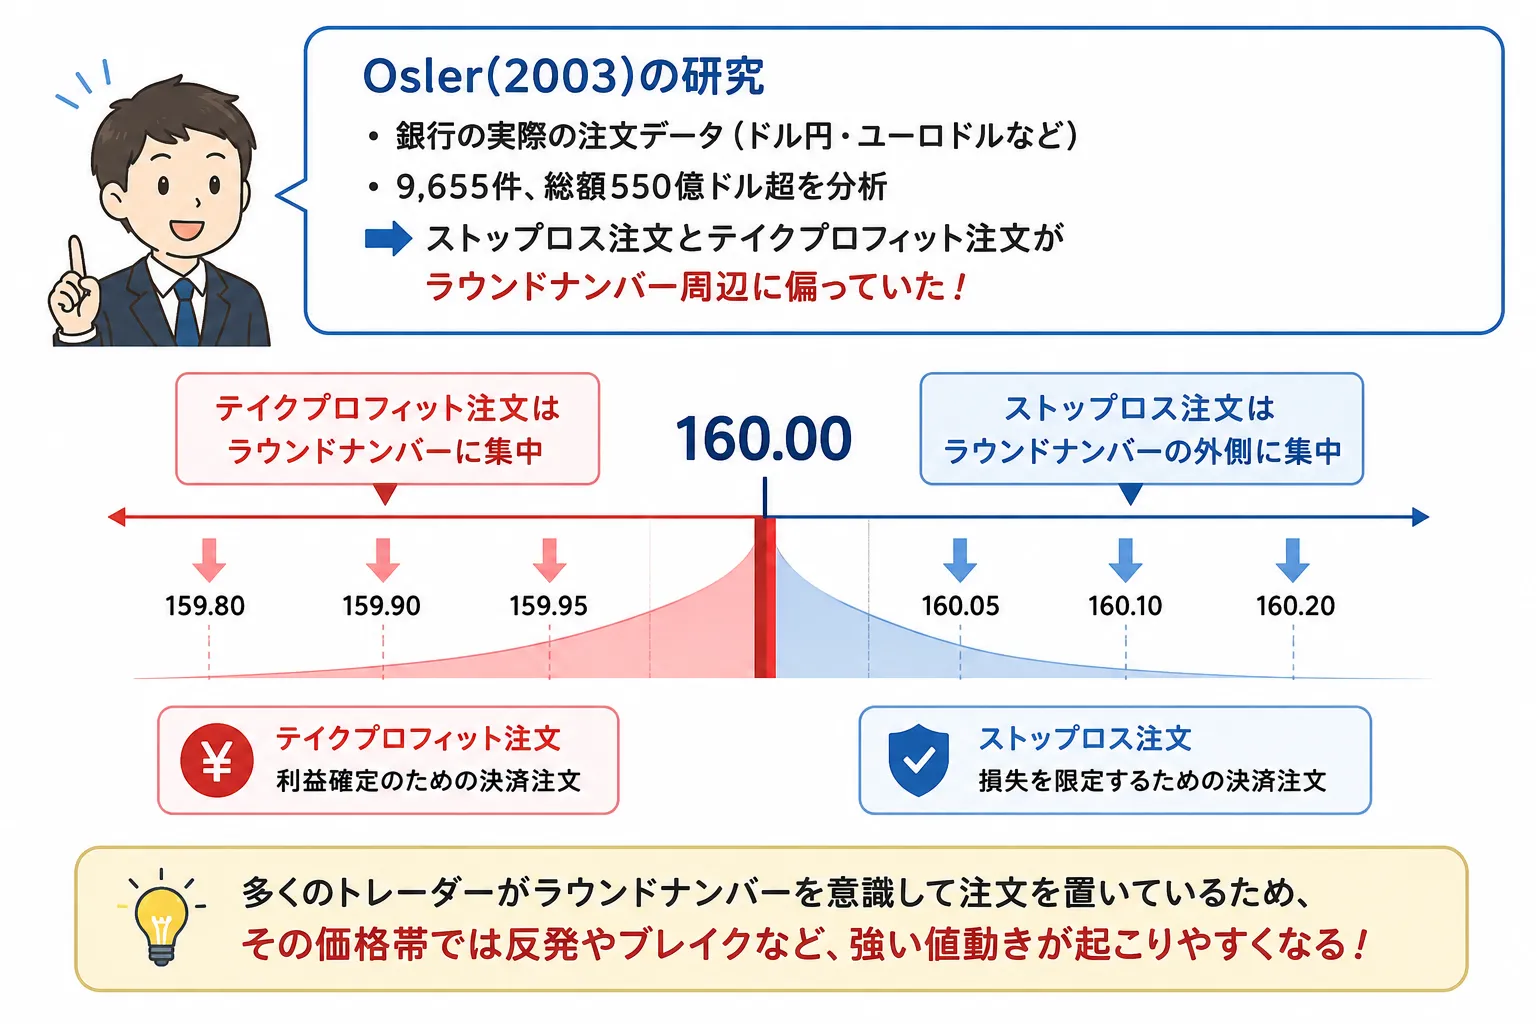
By Carol L. Osler,
"Currency Orders and Exchange Rate Dynamics: An Explanation for the Predictive Success of Technical Analysis"
This study analyzes actual stop-loss and take-profit orders of major FX banks.
Data include USD/JPY, EUR/USD, and more, totaling 9,655 orders worth over $55 billion.
A key finding is that
stop-loss and take-profit orders cluster around round numbers
A particularly notable finding is that
take-profit orders tend to cluster around round numbers, while stop-loss orders cluster just beyond round numbers
This is highly relevant to the common chart observations of
"rebound at highs"
"breakout above highs"
and how price moves.
Consider 160.00 as an example
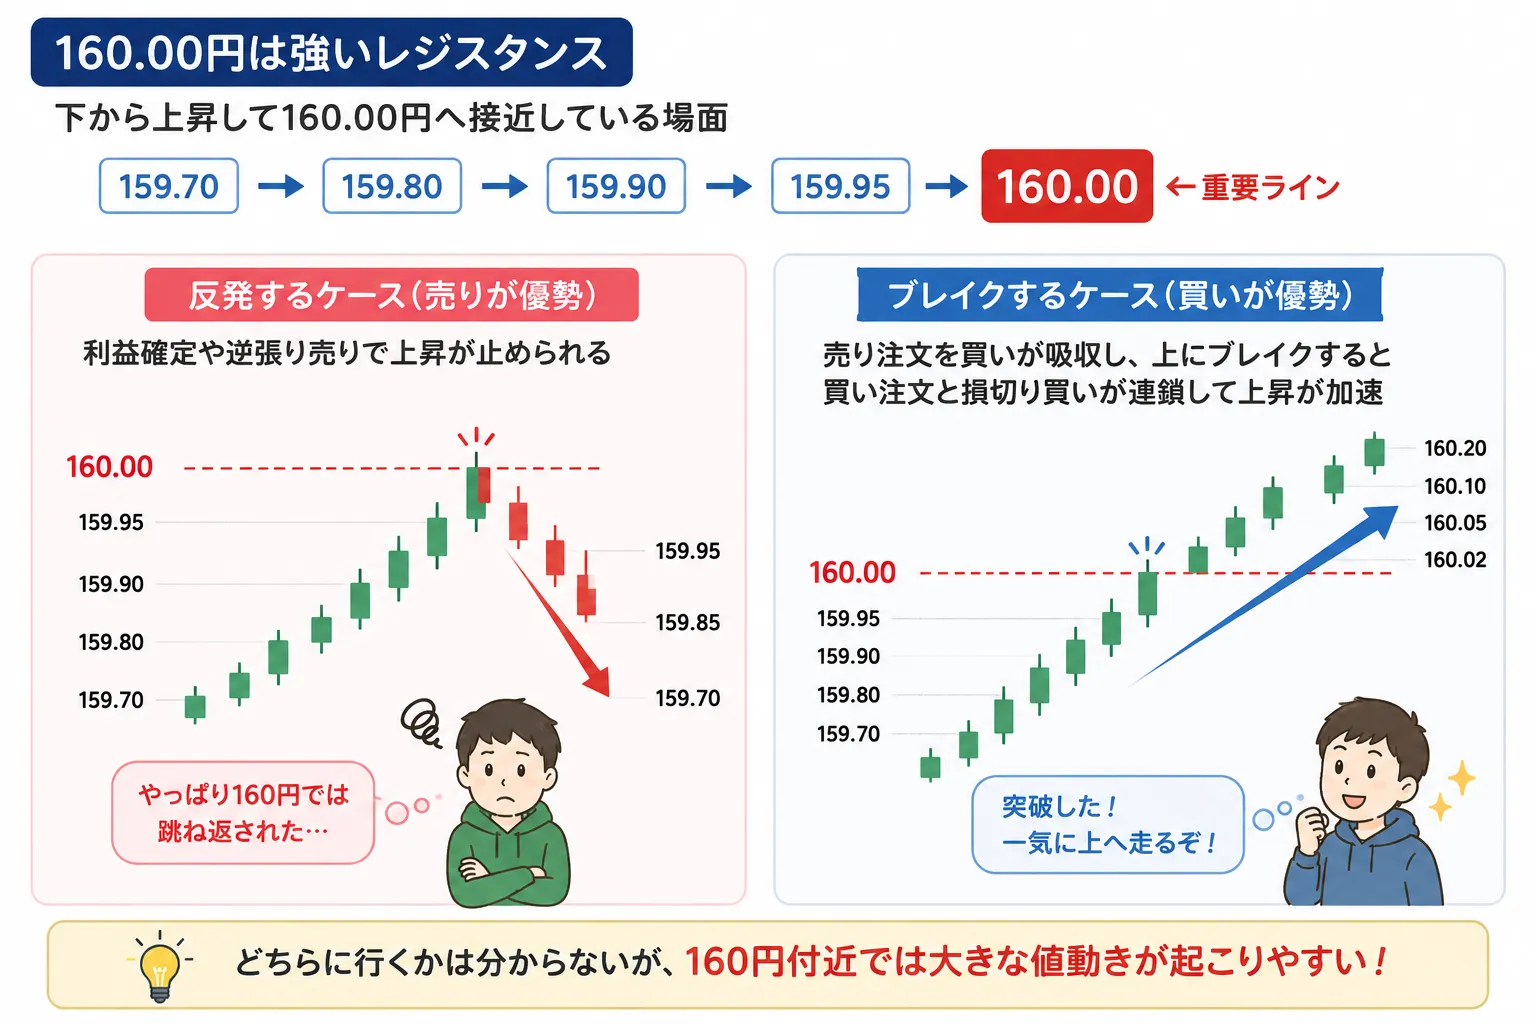
For example, USD/JPY is moving up toward 160.00 from below.
160.00 is a strong resistance level that has stopped advances multiple times in the past.
159.70
↓
159.80
↓
159.90
↓
159.95
↓
160.00 ← important line
where price might get stopped by profit-taking or new short entries around 160.00.
In such cases,
159.95
↓
160.00
↓
159.95
↓
159.85
↓
159.70
you may see a rebound.
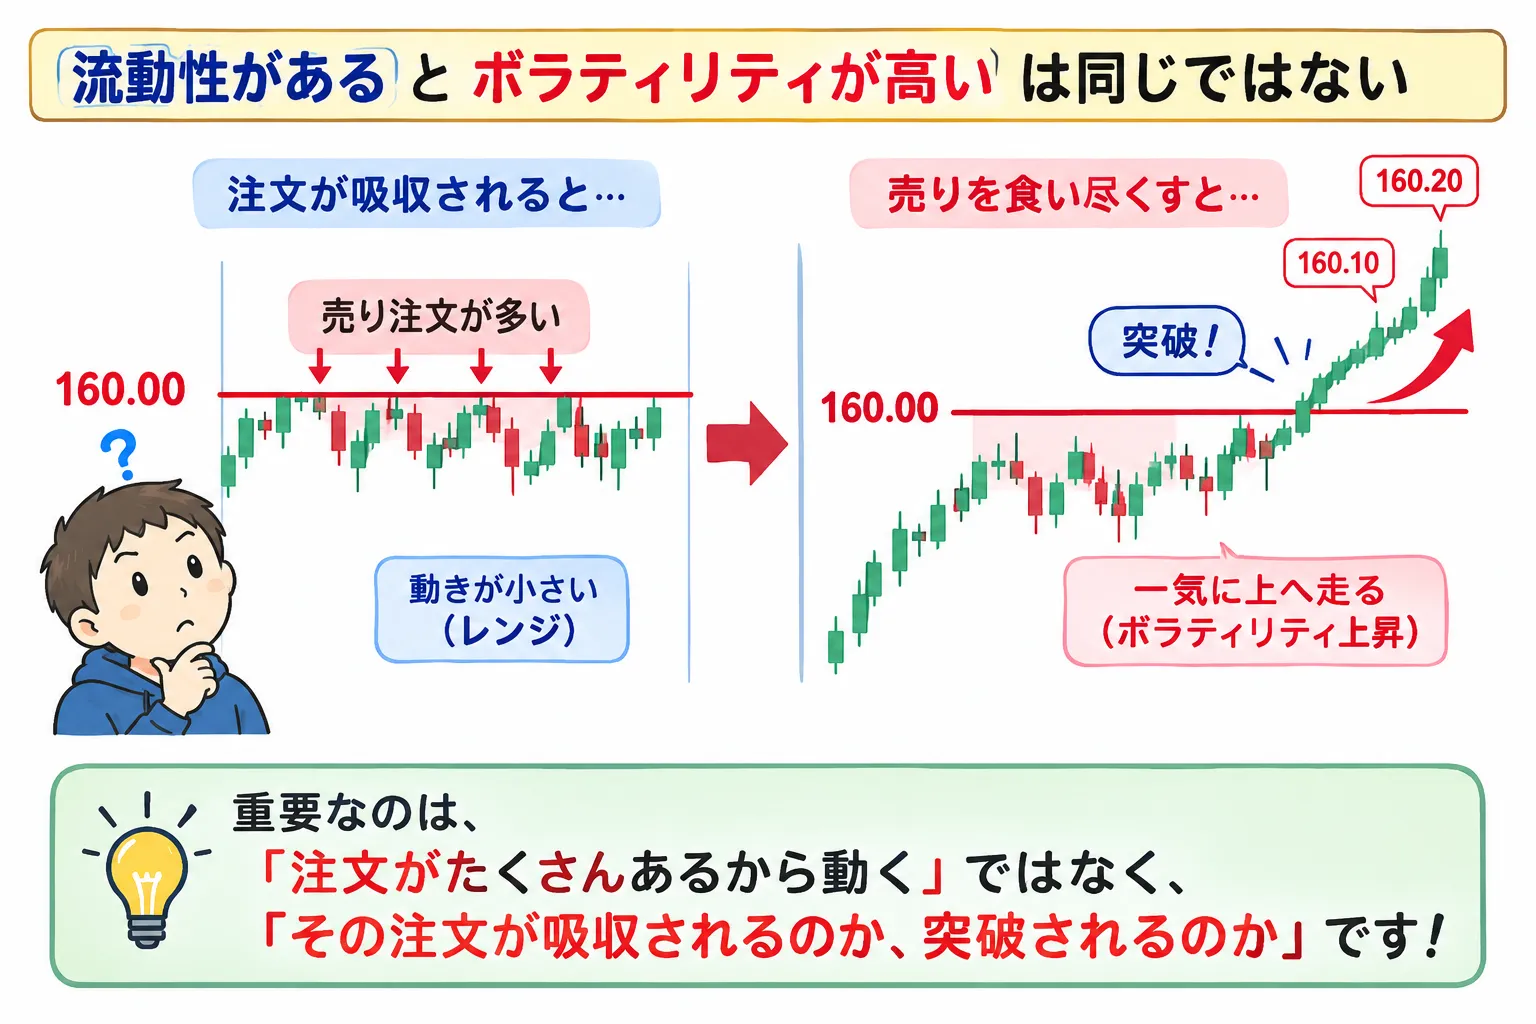
What happens if selling orders at 160.00 are absorbed by buying pressure?
Then the situation changes.
160.00
↓
160.02
↓
160.05
↓
160.10
↓
160.20……
This movement could occur.
Because above 160, there are not only breakout orders like "buy if price breaks 160," but also stop-loss buy orders from those who were selling near 160.
If price breaks 160 with buying pressure, that break can trigger more buy orders, accelerating price movement.
Price cascades caused by stops triggering
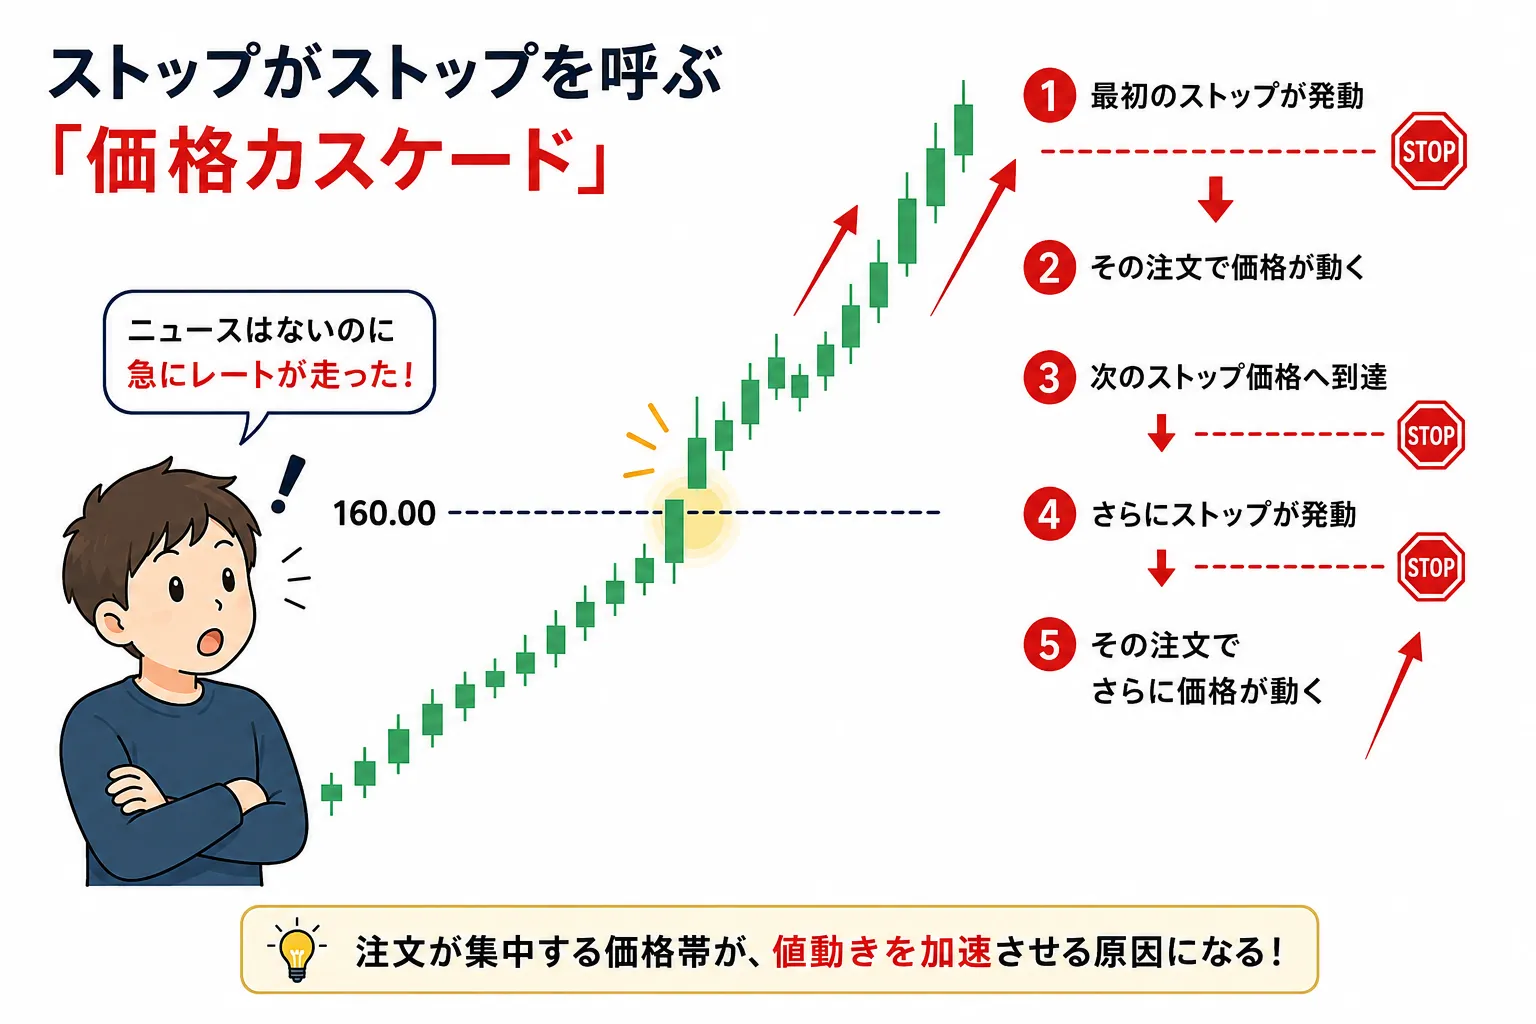
In another study, Osler analyzes this phenomenon through the lens of “Price Cascades.”
When the currency rate reaches price bands where stops cluster, price moves faster than usual.
First stop is triggered.
That movement shifts the price.
Next stop price is reached.
More stops trigger.
That order moves the price again.
A chain reaction.
I believe most traders have experienced this at least once.
"Prices run up even though there is no news."
Of course, not every sudden move is caused by stops.
Economic data, policymakers' remarks, large orders, and algorithmic trading all influence price movement.
However,
the fact that a price band with concentrated orders can itself accelerate movement is very important
to understand.
“Not knowing which way but not knowing nothing at all” is different
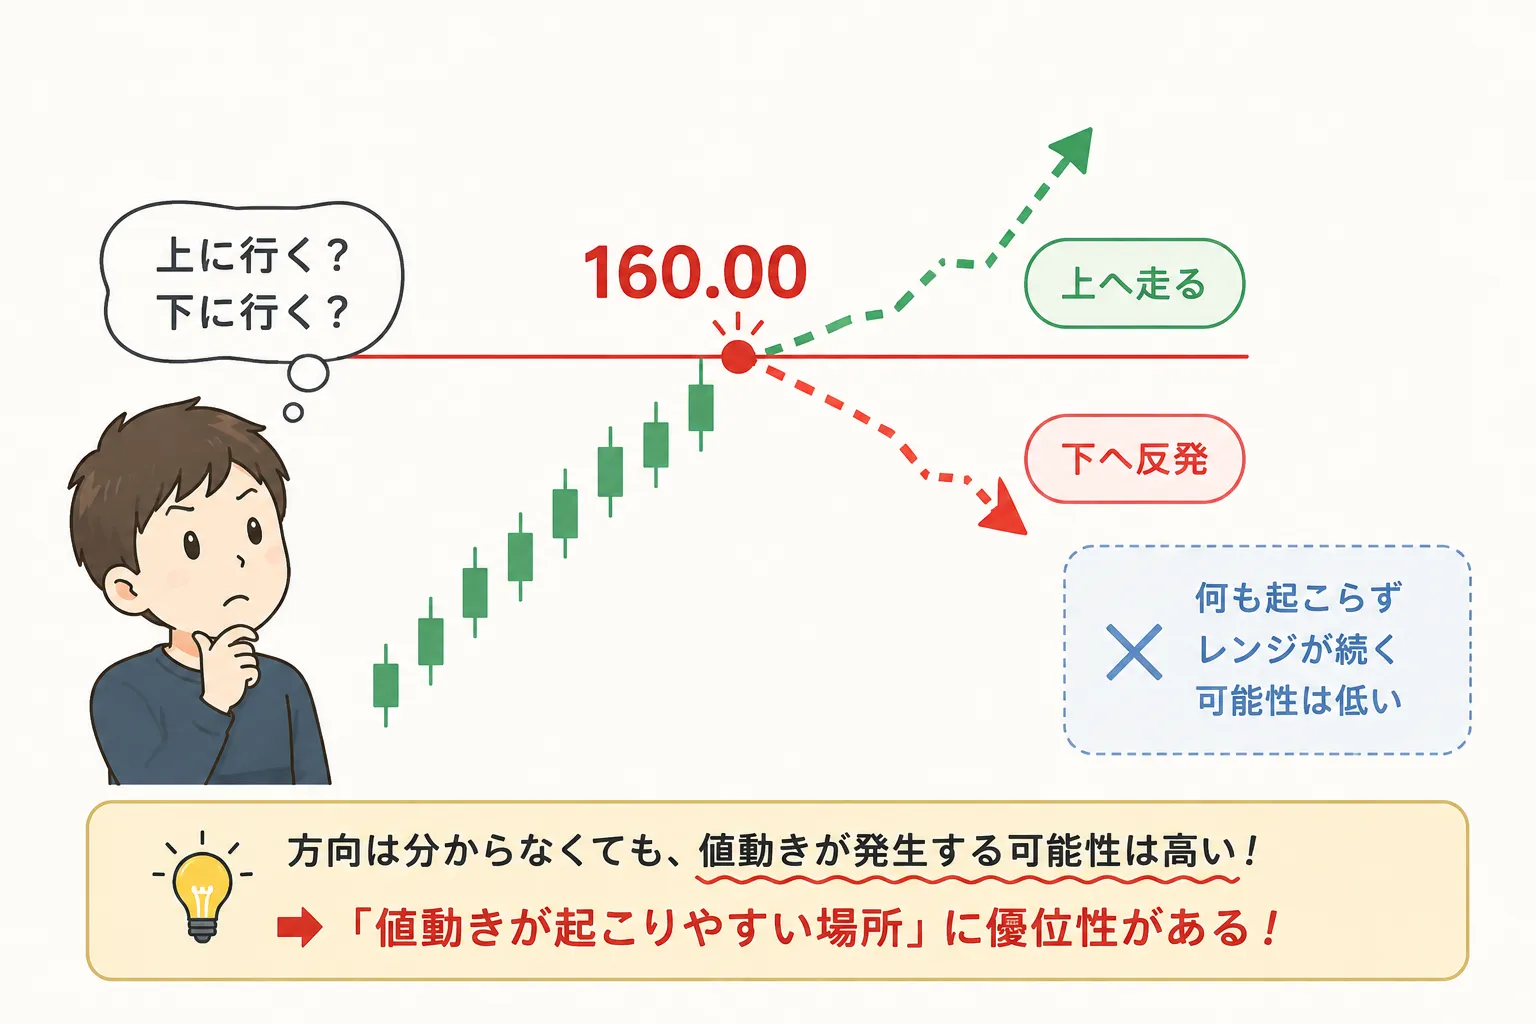
This is the main point I want to convey here.
“Will it rebound?”
“Will it break through?”
This remains uncertain.
Even if the probability is 50-50, direction forecasting provides no edge.
However, two scenarios are more likely: a move up above 160, or a rebound down from 160,
and the possibility that nothing happens around 160 with extremely low volatility is relatively low.
I find this very interesting.
However, "important lines do not guarantee non-volatile ranges"
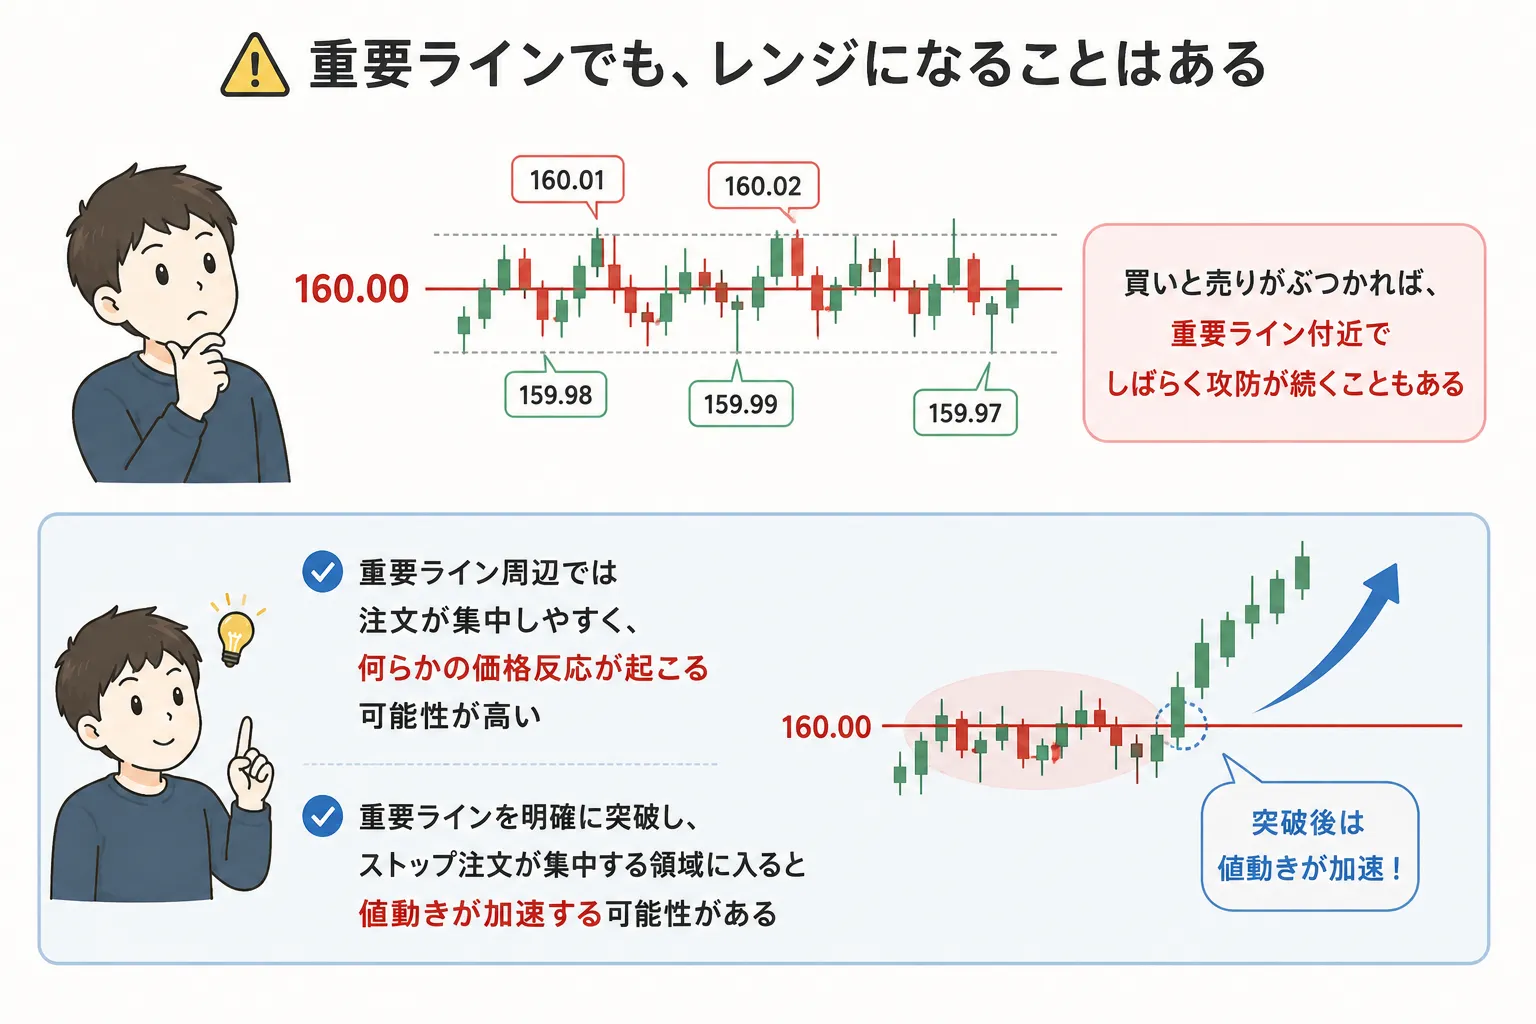
Please avoid misunderstanding here.
Rather, when there are large buy and sell orders near an important line, price battles may continue around that line for a while.
Therefore,
“Important line = guaranteed higher volatility”
is dangerous to claim.
that around important lines orders tend to cluster, so there may be a higher chance of some price reaction than at ordinary price ranges
and if price decisively breaks the line and enters the liquidity zone of stop orders, price movement may accelerate.
For scalpers, not direction but where price moves
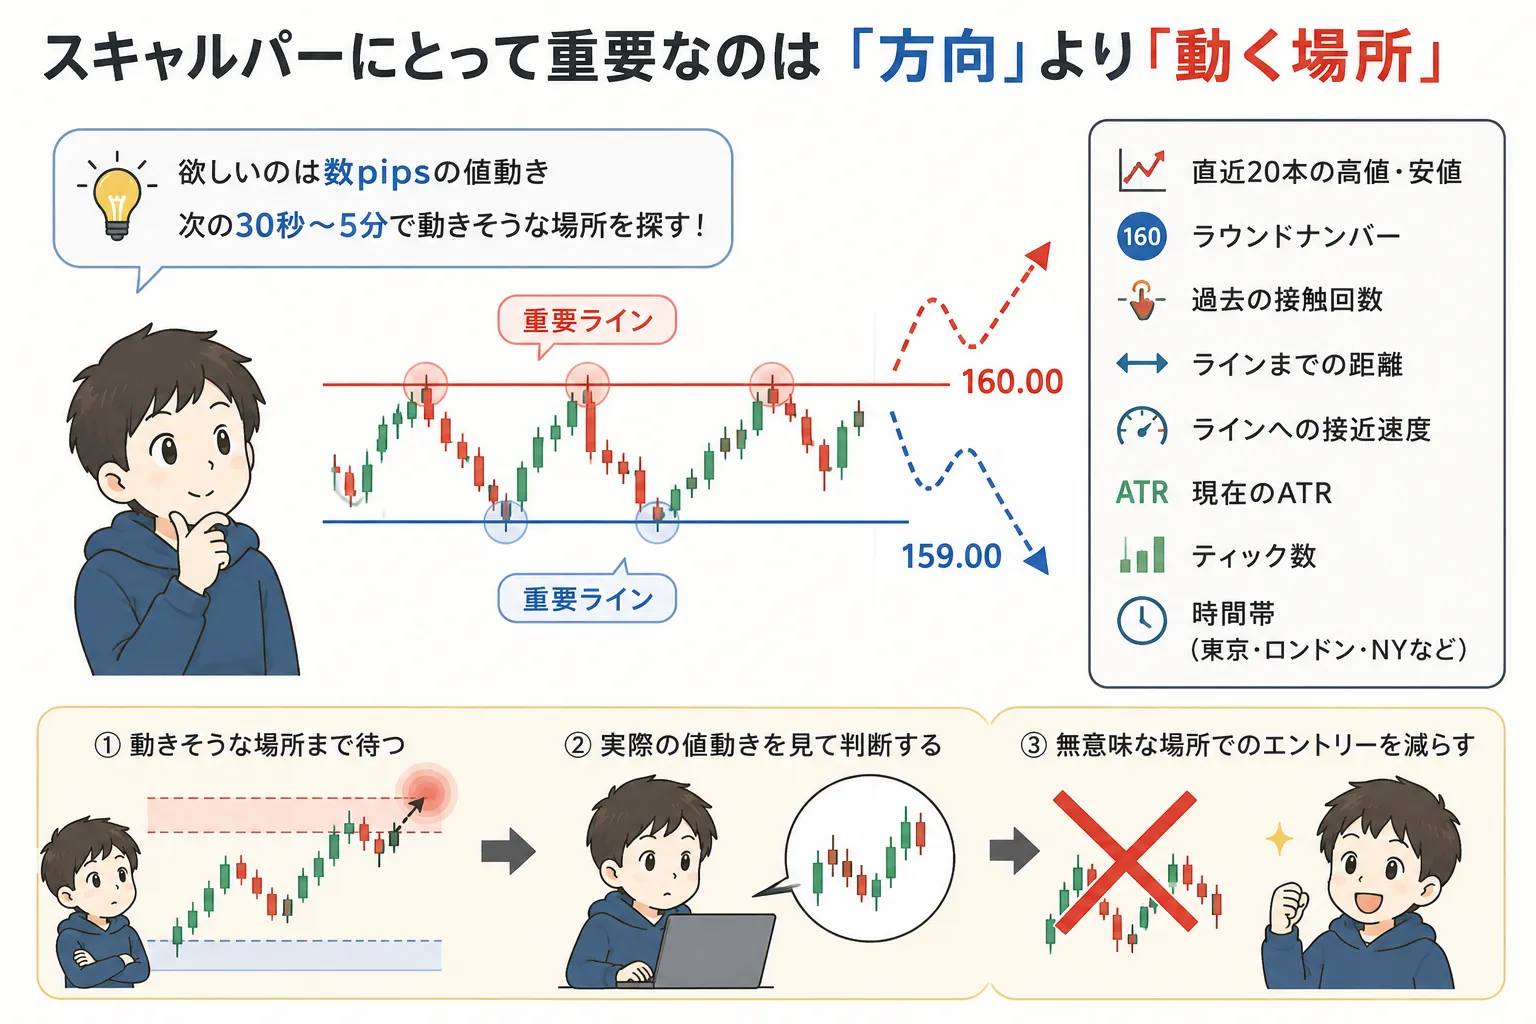
This approach is particularly compatible with scalping.
What scalpers want is not a large trend of tens or hundreds of pips.
A few pips, or even 1-3 pips, can suffice.
Therefore,
“Where is the area likely to move in the next 30 seconds to 5 minutes?”
is crucial.
Recent 20 bar highs/lows
+
Round numbers
+
Past touch counts
+
Distance to the line
+
Speed to approach the line
+
Current ATR
+
Tick count
+
Trading sessions in Tokyo, London, New York
can be combined.
wait for a place where price movement is likely to occur.
With this approach, you can reduce entries in meaningless places.
Day traders can wait for reaching important lines
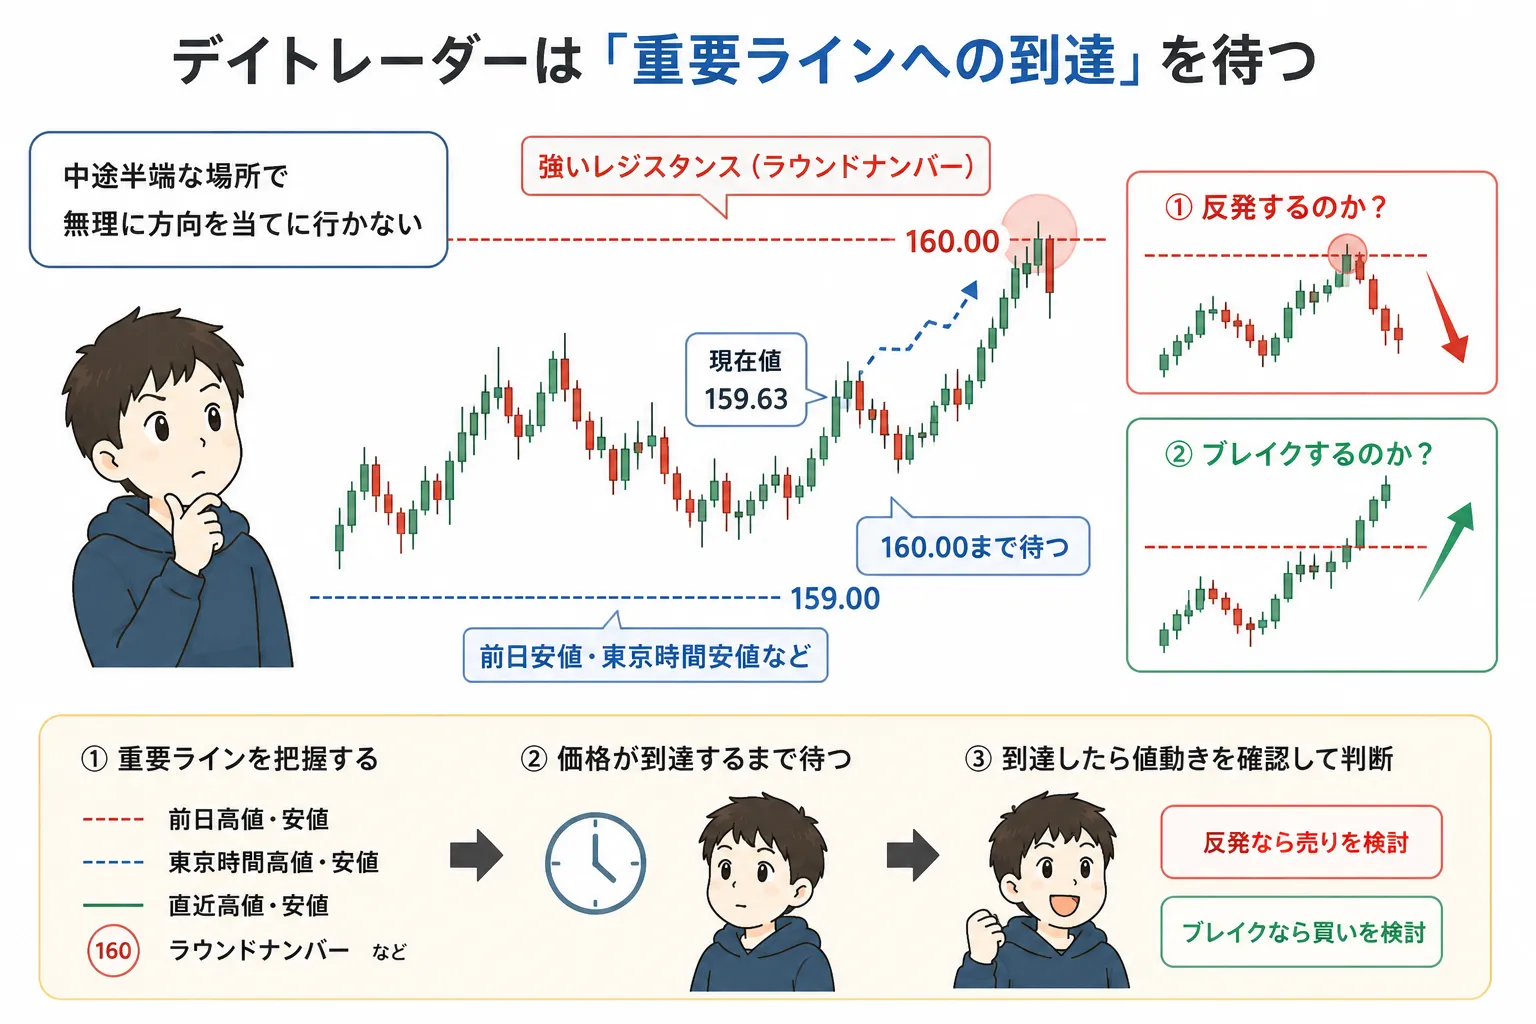
The same idea applies to day trading.
Previous day high
Previous day low
Tokyo session high/low
London session high/low
Nearest highs/lows
Major round numbers
and wait.
For example, if the current price is 159.63 and there is strong resistance at 160.00, you do not need to force a guess at direction at 159.63.
see whether it rebounds.
see whether it breaks through.
swings traders also need the same thinking
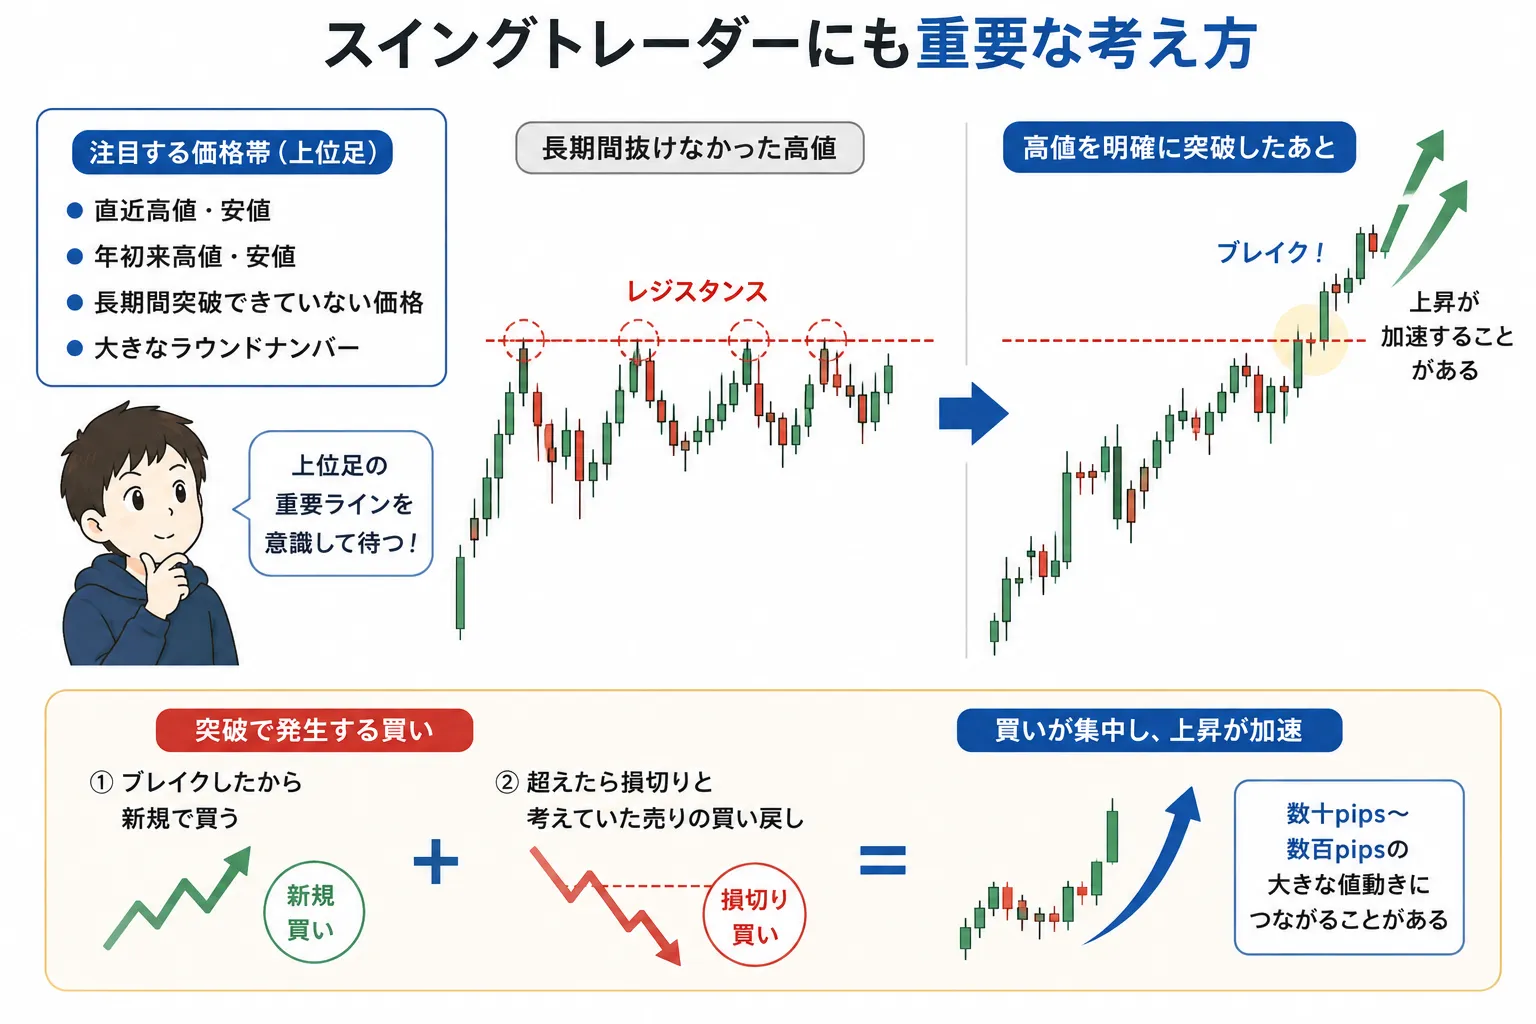
For swing traders, timeframes are larger.
Daily or 4-hour charts
- Recent high
- Recent low
- Year-to-date high
- Year-to-date low
- Prices that have not been breached for a long time
- Major round numbers
In swing trades, the battles are tens or hundreds of pips instead of a few pips as in scalping.
But the basic idea remains the same.
If you break through a long-ignored high,
you might see new buying pressure as new buyers enter since price breaks out.
This can lead to accelerated price movement.
The same concepts apply to stock markets
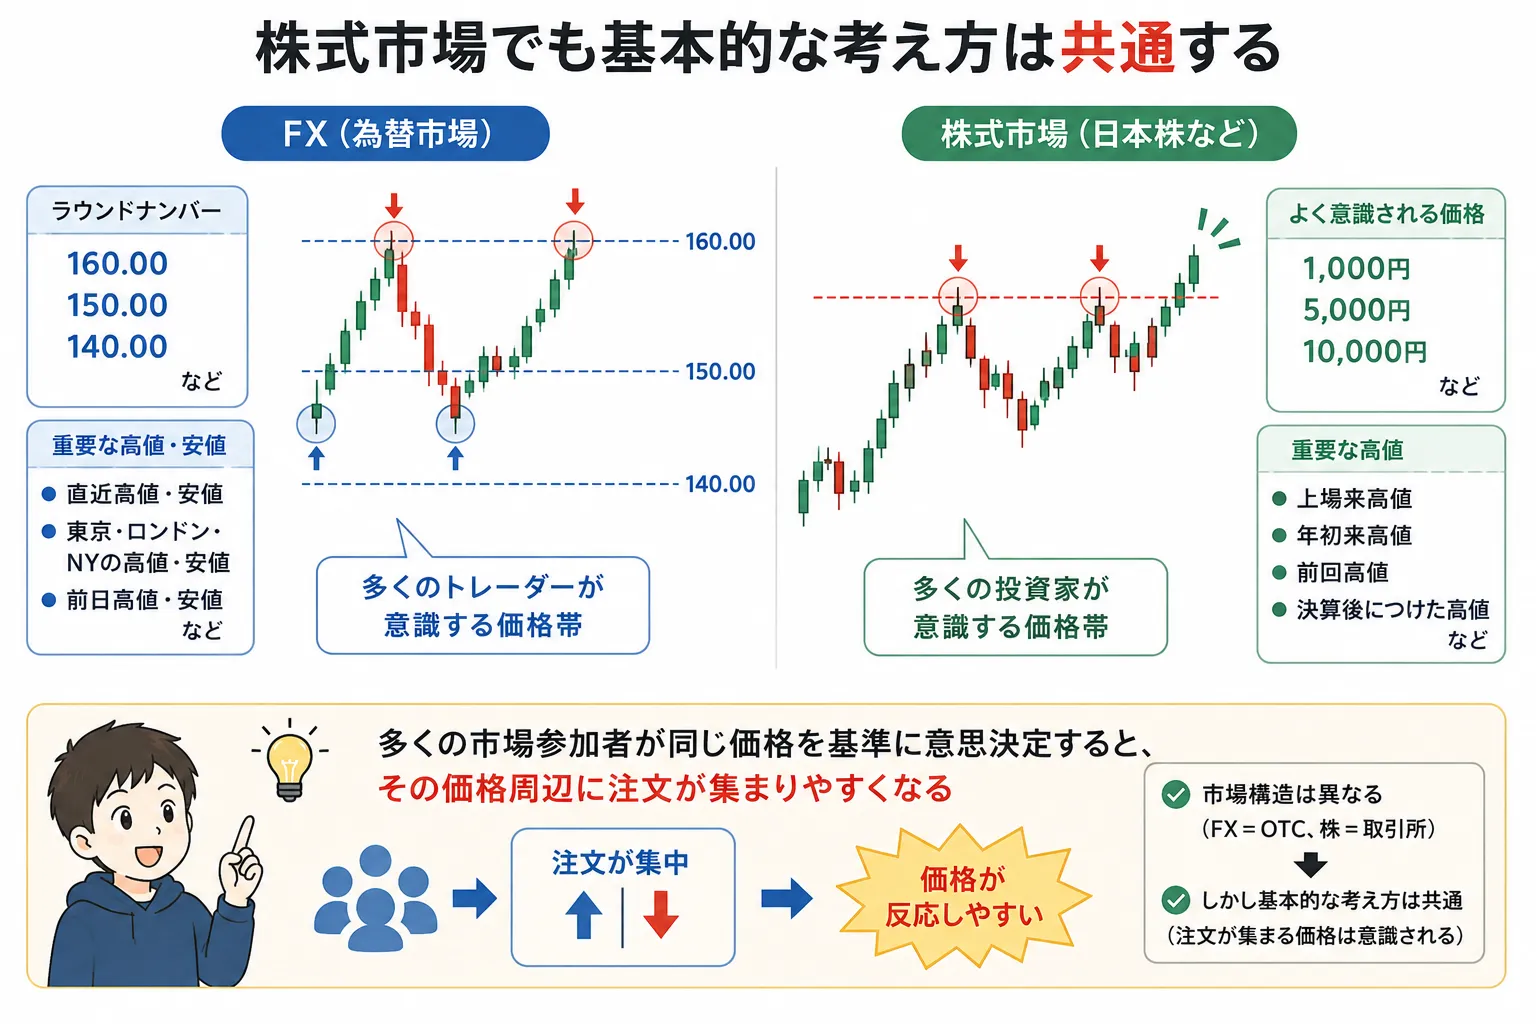
This approach is not limited to FX alone.
In stocks,
"1,000 yen"
"5,000 yen"
"10,000 yen"
are also price levels that market participants are mindful of.
Furthermore,
All-time highs
Year-to-date highs
Previous highs
Highs after earnings
are important as well.
FX is a decentralized OTC market, while stocks have exchange order books.
Thus, they cannot be treated as exactly the same.
the idea that many market participants make decisions based on the same price makes orders cluster near that price
is a common underlying concept.
The horizontal line itself doesn’t have magical power
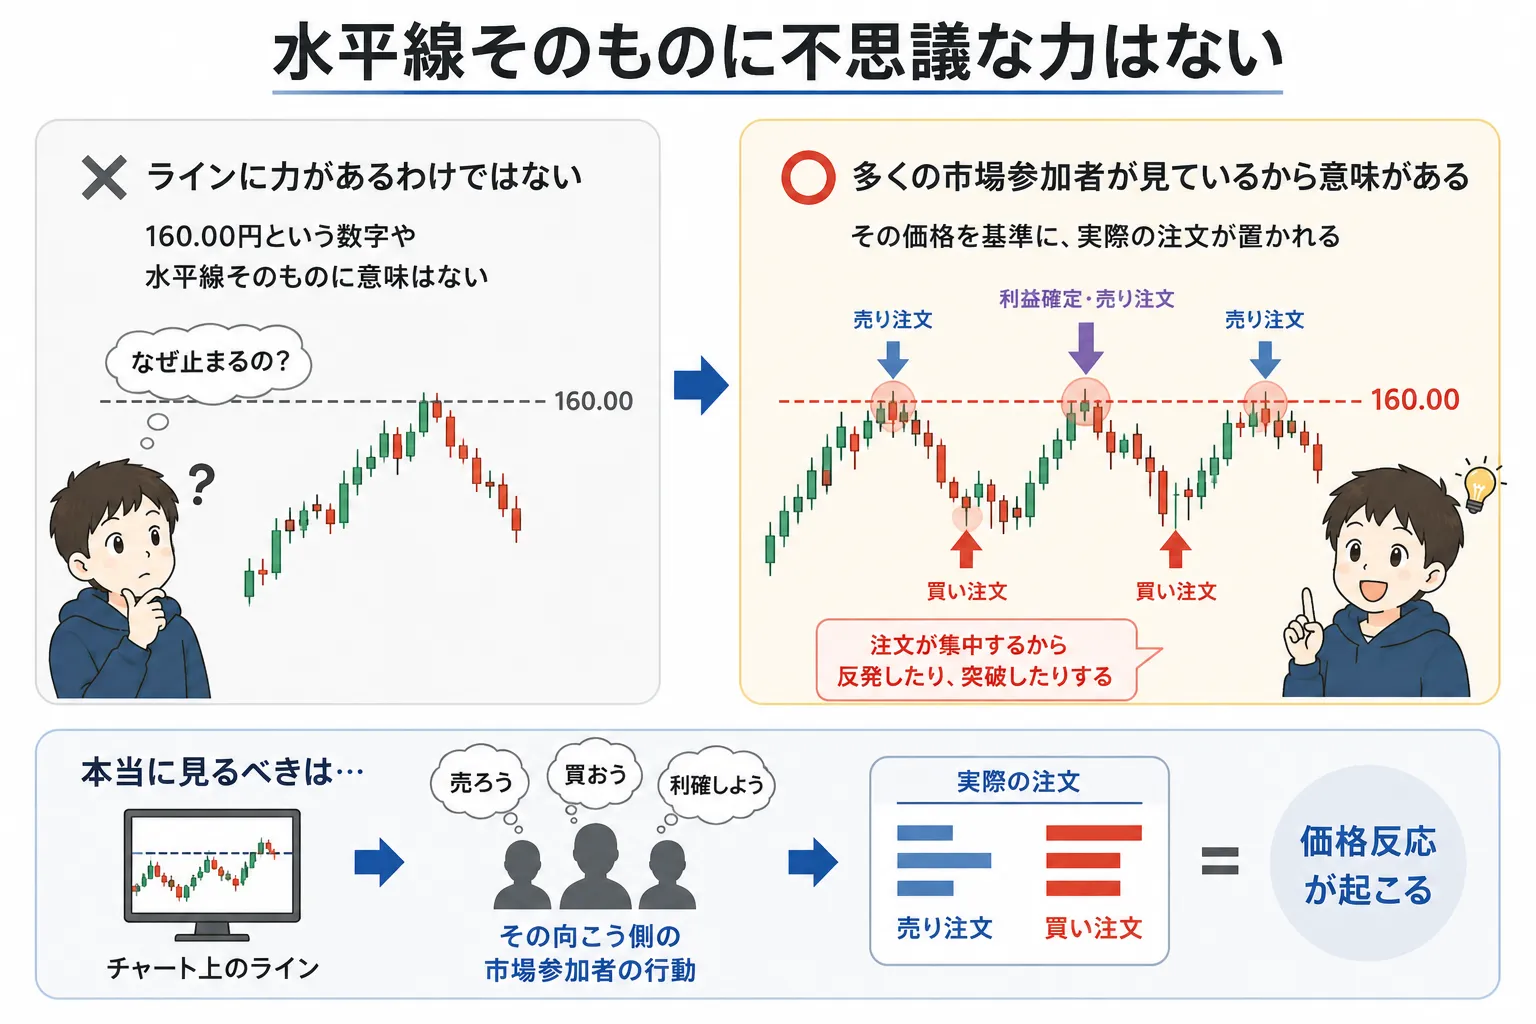
I think it is important not to misunderstand this.
There is no magical force in the number 160.00 that stops price on its own.
Drawing a line at recent highs does not guarantee a rebound.
What matters is
that many market participants watch that price
that actual orders are placed based on that price
instead of just looking at the line on the chart, observe the actions of market participants beyond it
.
Breakouts are not just about "crossing a line"
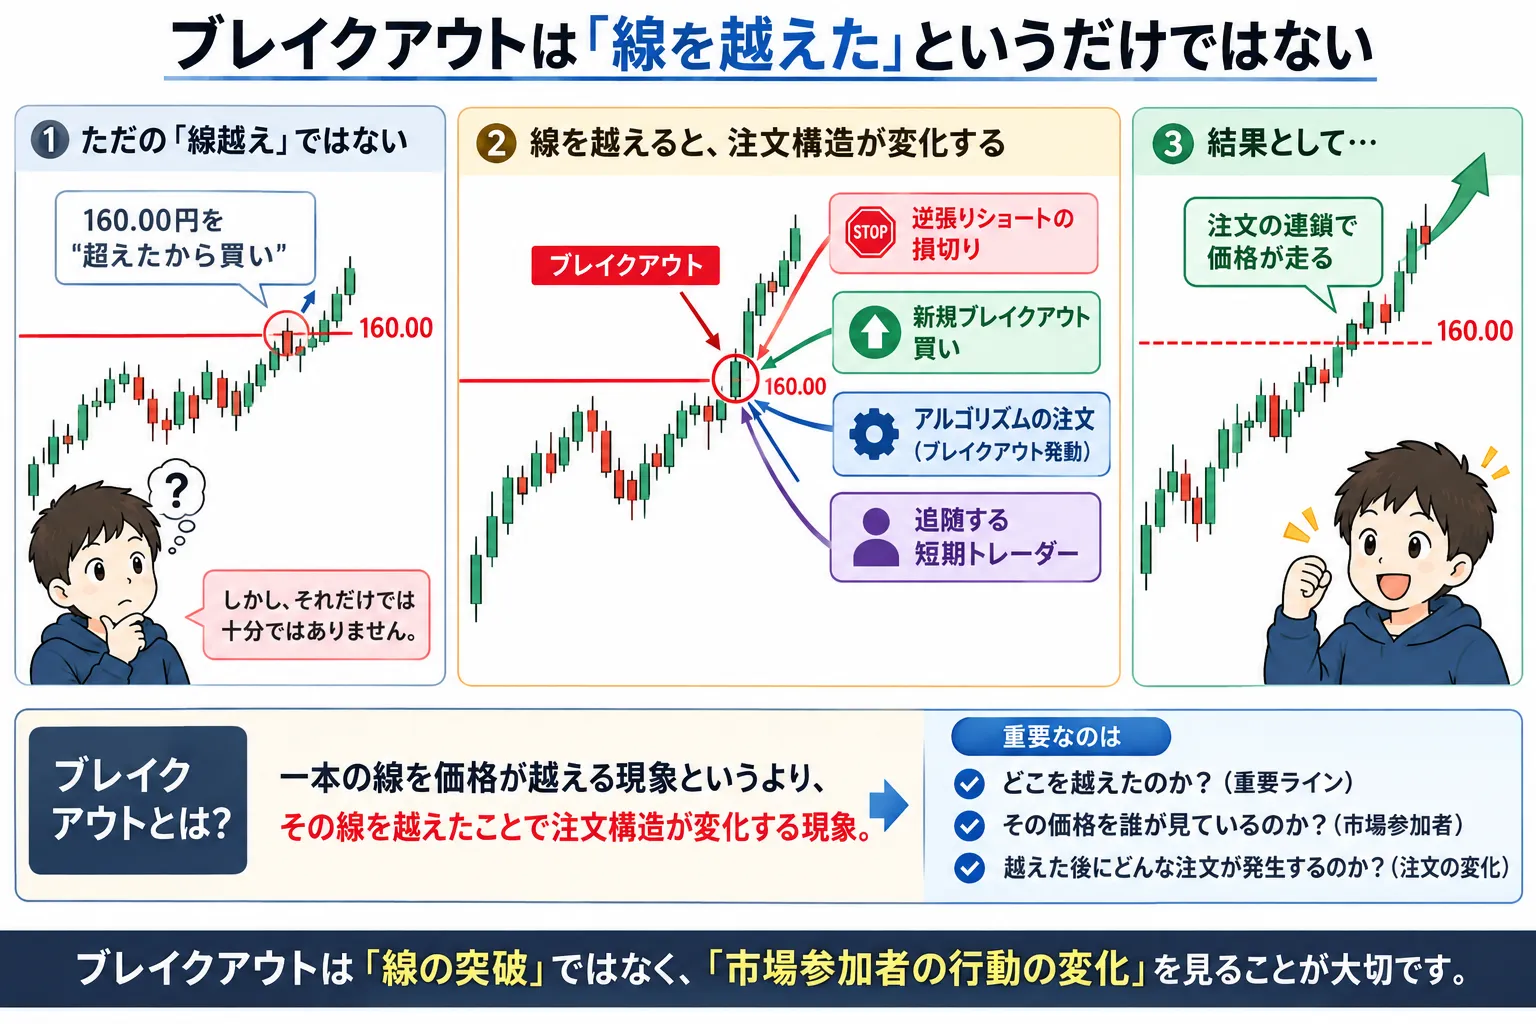
With this perspective, how you view breakouts changes.
Simply,
"Because price crossed 160.00, buy"
is not enough.
When 160.00 is breached, it can trigger
- short-covering on reversals
- new breakout buys
- algorithmic orders
- follow-on short-term traders
and so on.
That is why price runs.
how order structures change after crossing a line rather than simply crossing a line
.”
Look at how many pips remain to the high/low
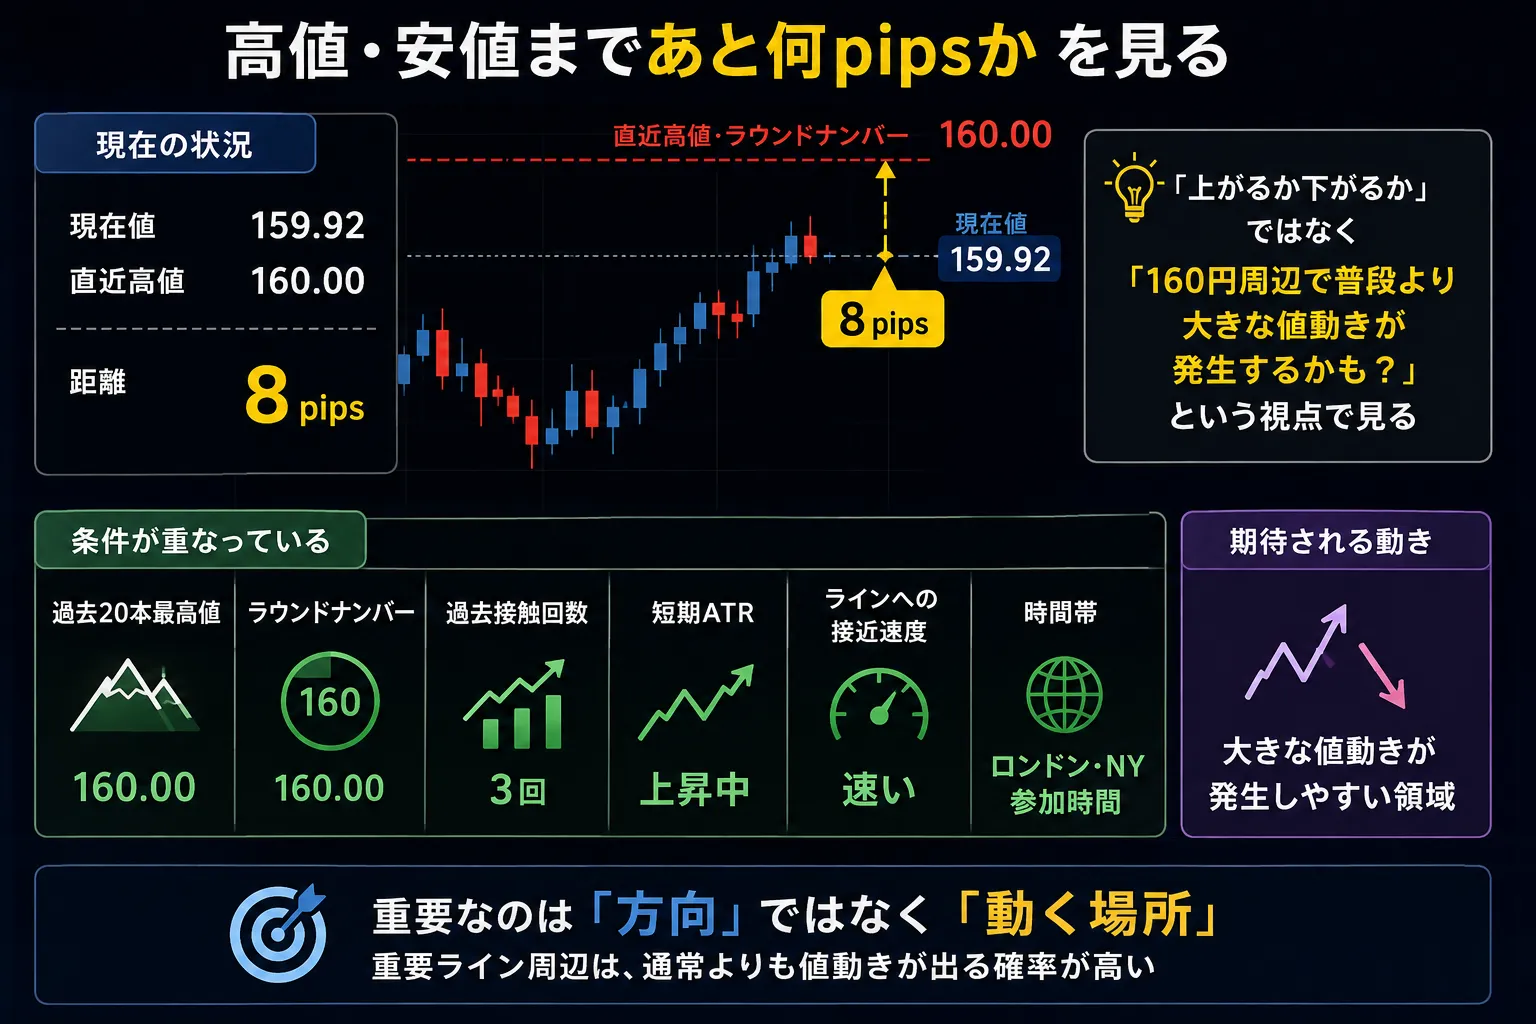
What I find interesting in actual trading is
the distance from the current price to an important line
for example,
Current price 159.92
Nearest high 160.00
Distance 8 pips
and further,
Past 20-bar highs 160.00
Round number 160.00
Past touch count 3
Short-term ATR rising
Line approach speed fast
London and NY trading hours
all align.
you would not ask, “Will it rise from 160?”
but rather,
“Around 160, will there be movement larger than usual?”
This perspective is more interesting to me than simple up or down forecasts.
Markets do not only predict direction
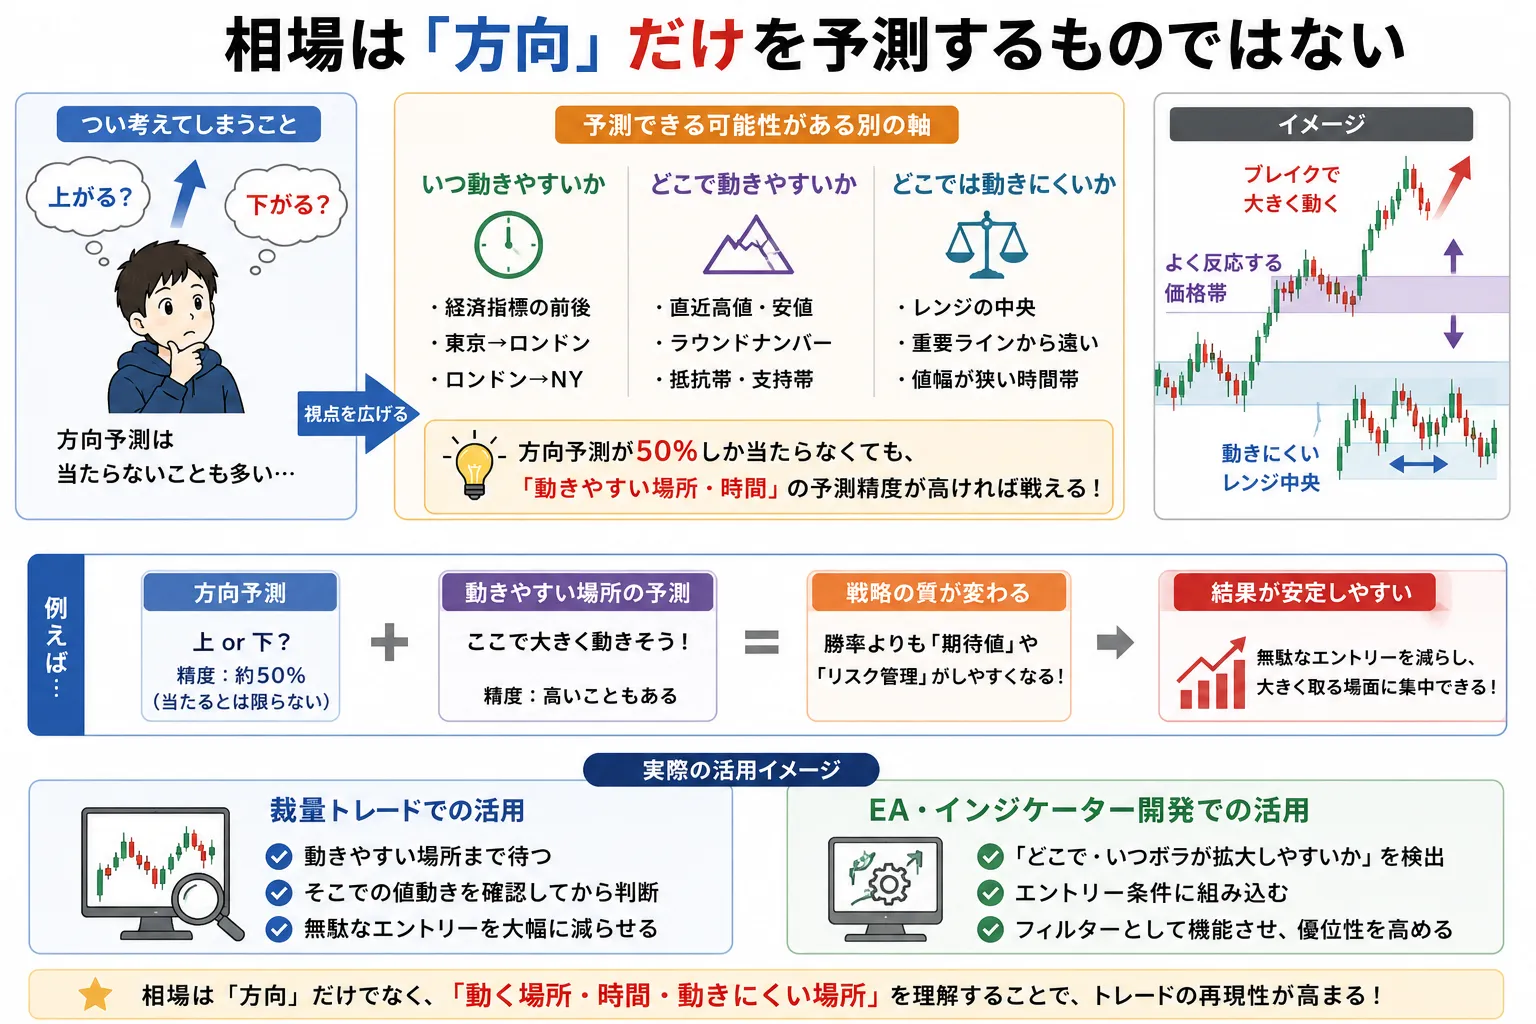
When people think of trading,
“Will price go up?”
“Will price go down?”
is often what comes to mind.
But the ability to predict is not limited to direction alone.
When volatility tends to happen
Where it tends to happen
Where it is harder for price movement
if the accuracy of predicting where volatility will expand is high, you can build a very different trading strategy.
This is not only a discretionary trading topic but also very interesting for building EAs and indicators.
Finally — Why high/low matter is about orders, not lines
Understanding why recent highs/lows and round numbers are noticed
cannot be reduced to simply
“everyone draws lines.”
The price level invites profit-takers, reversals, stops, and breakout entrants—each with different objectives.
Thus, when price reaches those levels, price behavior can differ from the norm.
The key is
not to insist you must always predict up or down
you can study where moves are likely to occur even if you don’t know where they will go
the fundamentals remain the same: consider where market participants look, where they place orders, where they cut losses, and where new entrants come in
don't just see a line; consider
“What orders might be waiting around this line?”
━━━━━━━━━━━━━━━━━━
Introduction to Okutore Logic Trainer
━━━━━━━━━━━━━━━━━━
An EA for discretionary trading usable on MT4.
・Practice Mode:Repeating entry and exit practice while replaying past charts
・Real Trading Mode:Trade management via chart buttons (supports real trading)
▼Details
Reference Studies
Carol L. Osler
“Currency Orders and Exchange Rate Dynamics: An Explanation for the Predictive Success of Technical Analysis”
The Journal of Finance, Vol.58, No.5, 2003.
A study analyzing concentrations of actual stop-loss and take-profit orders in the real FX market and price movements after breaking supports/resistances and round numbers.
Carol L. Osler
“Stop-Loss Orders and Price Cascades in Currency Markets”
Journal of International Money and Finance, Vol.24, No.2, 2005.
A study analyzing potential for rapid, self-reinforcing price moves called "Price Cascades" caused by the sequential triggering of stop-loss orders.