

I consulted MT5 AI assistant about stopping loss, but it was left unattended—resulting in BTCUSD plunging, leading to a second consultation
“If you consult AI about stop-loss and it warns you it’s dangerous, what would happen if you just left it as is?”
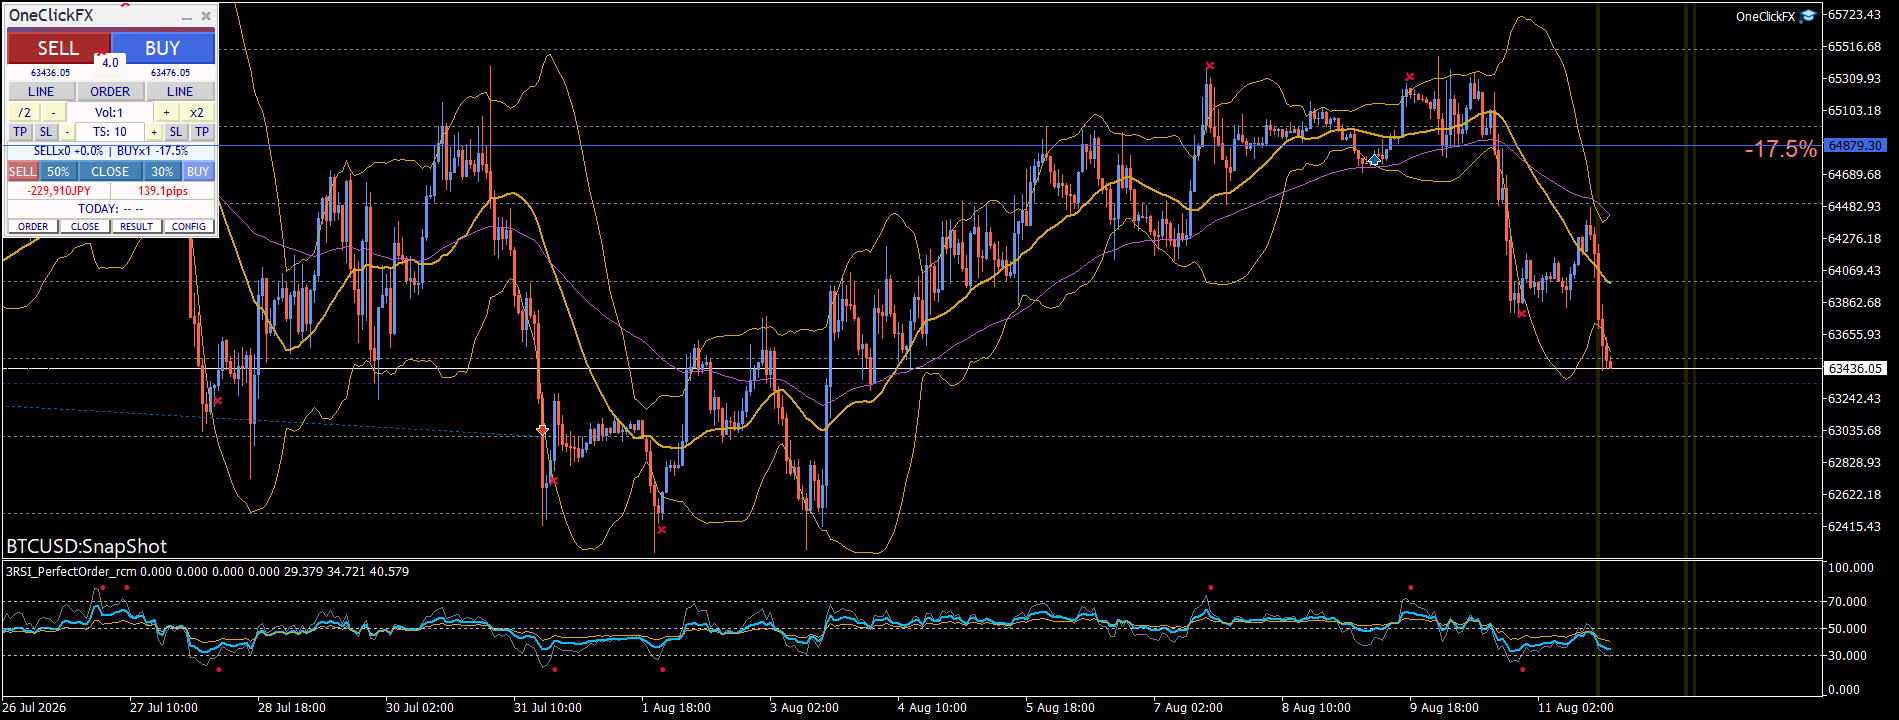
This time, when I entered BTCUSD, it initially trended upward. But it peaked after the RSI liquidation mark. After that, it plummeted, and even the signal “oversold” appeared.
Yesterday, I also consulted the MT5 AI Assistant about stop-loss, and even though I was in the red, it advised that setting an SL (stop-loss line) was essential.
However… it was left as is.
With a slight rebound, I hoped “maybe it can still go,” but it fell further. This time, for the same position,2nd consultationwas attempted.
The blue horizontal line is the Break-Even line, and a buy entry mark appeared a little before 18:00 on Aug 9. The red × mark is the RSI 3 exit/stop mark.
 ?MT5 Standard AI Assistant Complete Start Guide! Even beginners can start in 5 minutes
 ?I created a standard menu for MT5 AI Assistant. You no longer need to write prompts
MT5 AI Assistant Output
I applied the rules. I have loaded past records from the saved file.
✅ AI rule application complete
https://license.ioiv.net/ai/menu.txtcontents were applied.
Main rules applied:
- Provide information and analysis only,do not execute any trading actions such as submitting orders, settlements, modifications, cancellations, SL/TP changes, or lot size changes
- When current information is needed, check current price, charts, news, and account information within possible scope
- Use the saved file
MT5_AI_ASSISTANT_LOG.mdas a reference (past records are not treated as current facts) - Append to the log at session end
? Previous session records (2026-08-11)
- BTCUSD: 63,800–64,500 range, a weak rebound with low volume
- USDJPY: Upward trend continues but under resistance zone just below 159.4–159.6; immediate entry was prudent to skip
- Positions held: BTCUSD buy 1.0 lot (#515941633, entry 64,826.95) with unrealized loss around −110,000 yen, no SL/TP
- Ongoing check items: US CPI release, BTC deviation at 63,800/64,500, USDJPY 159.6/158.9
※ The above is a past record. I will verify the current situation separately.
MT5 AI Assistant
What will you do?
- Investigate news
- Analyze charts
- Consult about entries/settlements
- Analyze held positions
- Review trades
- Analyze signals/indicators
0If you enter, you return to the main menu. You can also ask in normal prose, not by number.
4
I have checked the current held positions.
List of held positions:
| # | Asset | Direction | Lot | Entry | Current price | Floating P/L |
|---|---|---|---|---|---|---|
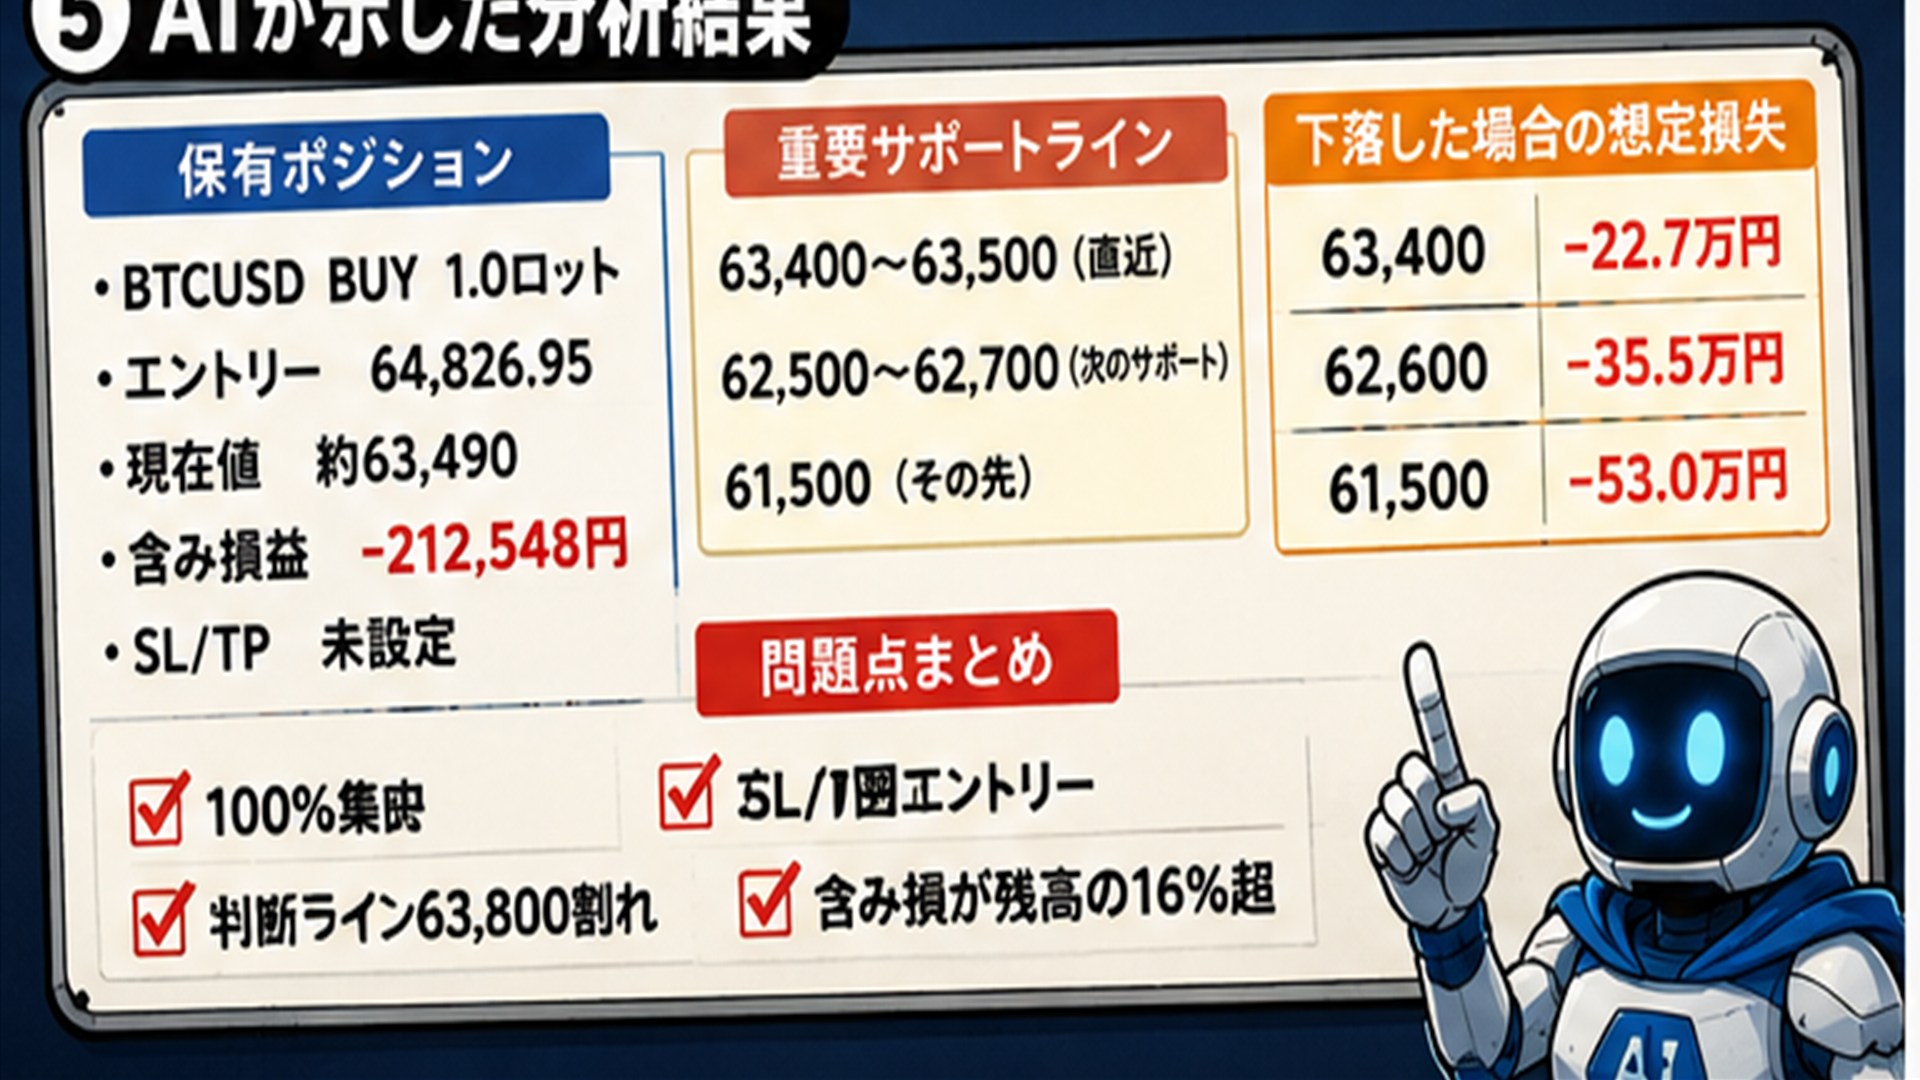
| 1 | BTCUSD | BUY | 1.0 | 64,826.95 | 63,492.25 | −212,548円(including swap −8,323円) |
(There are no pending orders)
Please select the position to analyze.
- BTCUSD
- Overall
- Return to menu
2
? Position Analysis (Overall)
Key conclusions (prioritized)
The current portfolio is a single BTCUSD buy position, fully concentrated in Bitcoin.The previous decision line was63,800 yen (USD) or lower, currently around 63,490. Unrealized loss has expanded from the previous roughly −110,000 yen toabout −213,000 yen because SL/TP is not set, there is no mechanism to stop losses on decline.
1. Position details
| Item | Content |
|---|---|
| Asset | BTCUSD |
| Direction | BUY |
| Lot | 1.0 |
| Entry price | 64,826.95 (8/9 09:10) |
| Current price | Approximately 63,490 |
| Floating P/L | −212,548円 |
| Swap | |
| Total floating P/L | Approximately −213,010円 |
| SL / TP | Not set |
| Order origin | Expert (EA / OneClickFX) |
※ This is operated on a demo account (******).
2. Account status
| Item | Amount |
|---|---|
| Balance | 1,310,290円 |
| Equity | 1,088,957円 |
| Used margin | 19,063円 |
| Effective margin | 1,069,894円 |
The floating loss is about16.3% of the balance. There is no margin call risk at present, but losses are expanding.
3. Current chart status
Daily chart (D1):
- 7/21 high 66,942 peaked, then corrected → 62,200–62,400 fell from 8/1 to 8/3
- Recovered to around 65,450 by 8/9 → butTwo consecutive large bearish candles on 8/10–8/11
- 8/11 low 63,421, close 63,489bearish breakout signs
Hourly chart (H1):
- Previous supportclearly broke 63,800–64,000
- Currently clinging to a near-term low zone of 63,400–63,500 (8/11 low 63,421)
4. Important price ranges
| Category | Price range | Meaning |
|---|---|---|
| Nearest support | 63,400–63,500 | |
| Next support | 62,500–62,700 | |
| Beyond that | ||
| Resistance ① | ||
| Resistance ② | ||
| Resistance ③ |
5. Risk estimation (current loss expansion scenario)
| Price reached | Estimated loss (approx.) | Balance ratio |
|---|---|---|
| 63,400 (nearest low) | approximately −227,000円 | 17.3% |
| 62,600 (next support) | approximately −355,000円 | 27.1% |
| 61,500 | approximately −530,000円 | 40.4% |
※ This is an estimate. Actual profit/loss varies with swaps and spreads.
6. Overall portfolio problems
- 100% concentration in a single asset and direction— All risk concentrated in one BTCUSD buy
- SL/TP not set— Losses do not stop automatically as they grow
- Entry near top— Bought around 65,000 resistance after July high of 66,942
- Take out below the decision line— The line previously noted as “if below 63,800, be cautious” has already been breached
- Loss exceeds 16% of balance— Large floating loss from risk management perspective
7. Future outlook (evidence for decision)
- Bullish scenario: If it stops falling at 63,400–63,500 and recovers to 64,000–64,300, a rebound is possible
- Bearish scenario: If it drops below 63,400, there is room to fall to 62,500–62,700. If it breaks further, 61,500 is also in view
- Note: Since there is no SL/TP, losses during a decline cannot be stopped. The decision must be made by the user (I will not perform trading actions)
To investigate further
- Consider the stop-loss line — where is reasonable to place it
- Consider the take-profit line — target if price rebounds
- Analyze the current chart more deeply
- Check related news (latest Bitcoin market material)
- If price falls further, perform a detailed risk estimation
- Compare keeping position vs closing
- Return to menu
4
? BTCUSD Related News (most recent 8/11)
Key items organized by priority.
? Most important: US CPI release imminent — market is on a knife edge
- “July CPI Puts Bitcoin and Markets on a Fed Knife Edge”— July CPI puts Bitcoin and markets in Fed’s tightrope
- “Will July CPI Reset the Fed, Bitcoin, and Every Major Market?”— Will CPI shift Fed, BTC, and all major markets
- Continuing from the previous session, CPI release is the biggest event— Depending on the result, BTC may move significantly.
? Sell pressure (bearish factors)
- Strategy (MicroStrategy) sold Bitcoin for two weeks in a row— “Why Strategy Is Selling Bitcoin” / “Saylor’s Strategy Sells Bitcoin for Second Week in a Row”
- Whales sold 1,274 BTC (about $81.5 million)— Distributed selling through multiple institutions
- BlackRock-related address moved 838 BTC to Coinbase (about $77.8 million)— Indicates selling pressure
- FalconX deposited 300 BTC to Coinbase (about $19.18 million)
- Nordic firm rises to Europe’s second-largest BTC treasury whilemajor companies continue selling— pattern
? Buy factors (bullish elements)
- Whales accumulating 46,000 BTC— however network activity remains weak, hinting at recovery
- BTC price recovers with ETF inflows(DailyForex technical analysis)
- Arthur Hayes: “Fed relief for USD will push BTC, gold, ETH higher”— Outlook that yen-buying intervention could lend risk assets support
⚠️ Other notable points
- Gold above $4,400— Peter Schiff argues “Sell BTC and Strategy stocks for gold” (capital shift)
- CryptoQuant revises CME position interpretation— BTC leverage funds overall are not net long
- New holder cohorts approaching break-even; 3–6 month holders are in the red
? Implications for held positions (summary)
Sell pressure persists, but with CPI looming as a non-negotiable event, the market lacks clear direction.Although whale accumulation and ETF inflows present rebound factors, recent price has breached 63,800, andbearish factors dominate. Depending on CPI results, both sharp upside and downside moves are possible. Carrying the event with no SL/TP across increases risk beyond expectations.
If you want to investigate further
- Check CPI release date and forecast
- Review Bitcoin ETF fund flows (inflows/outflows)
- Examine Strategy’s selling content and scale
- Outline the impact of this news on held positions
- Check impact on other markets (e.g., USDJPY)
- Return to menu
The question is whether to cut losses. I’ll answer directly.
? Conclusion
Saying “you must cut losses” is not definitive, but the current situation is one where the conditions to consider cutting losses are fully met.At minimum, leaving CPI (US CPI release) across without SL is the most undesirable option from a risk management perspective.
Why stop-loss is becoming rational (bearish factors)
- Clearly broken the judgment line at 63,800— The line noted in the last session as “63,800 break would be caution” has already been breached
- Floating loss exceeds 16% of balance (about −213,000 yen)and SL/TP not set
- Sell pressure is dominant— Strategy two weeks of selling, whale selling of 1,274 BTC, BlackRock-related transfers
- Rebound volume is weak— Even if a rebound occurs, upside buying power is limited
- CPI, a high-volatility event, is imminent— If CPI misses, losses could expand rapidly
- Loss if price falls further: If it drops to 62,500–62,700, losses could expand to about −350,000 yen (27% of balance)
Reasons not to rush into stop-loss (bullish factors)
- Near the recent low 63,421, close to support— There is still a chance of rebounding within the support zone
- Whales accumulating 46,000 BTC, ETF inflows continuing
- If CPI is dovish (rate cut expectations), a sharp rebound is possible— Arthur Hayes also sees yen rescue by the Fed lifting BTC
- Demo account means no real loss — valuable for learning
? Decision point
| Options | Content | Estimated loss |
|---|---|---|
| A. Close losses now | Loss realized, risk freed | Approximately −213,000 yen (16.3% of balance) |
| B. Set SL and hold | Auto-close below 63,400, watch CPI direction | |
| C. Leave as is |
Note:Current price (63,490) is almost on the line of the nearest low 63,421. If you have a rule “cut losses if it falls below 63,400,”the decision is effectively the same as cutting now.
My view (for reference only)
- Technical: As it has broken support, the downtrend is likely to continue
- Fundamental: Selling pressure is dominant, but the trend could change depending on CPI
- Overall: If you cut losses, now (within support area) is the price-optimal timing. If you hold,be sure to set SLand aim to settle before CPI release (likely Aug 12 in Japan time; exact time to verify on economic calendar)
Ultimately, please make your own decision.I only provide analysis and information; I will not execute settlements or modify orders.
If you have any questions, please ask in normal conversation, for example “Where specifically should I place SL?”, “Would like to know CPI impact in more detail”, “If I don’t cut and hold, what strategy should I consider?”
This is the AI assistant’s response up to here.


Completely risk-free trade simulator to freely practice and verify!
Details page for One-Click FX Training