
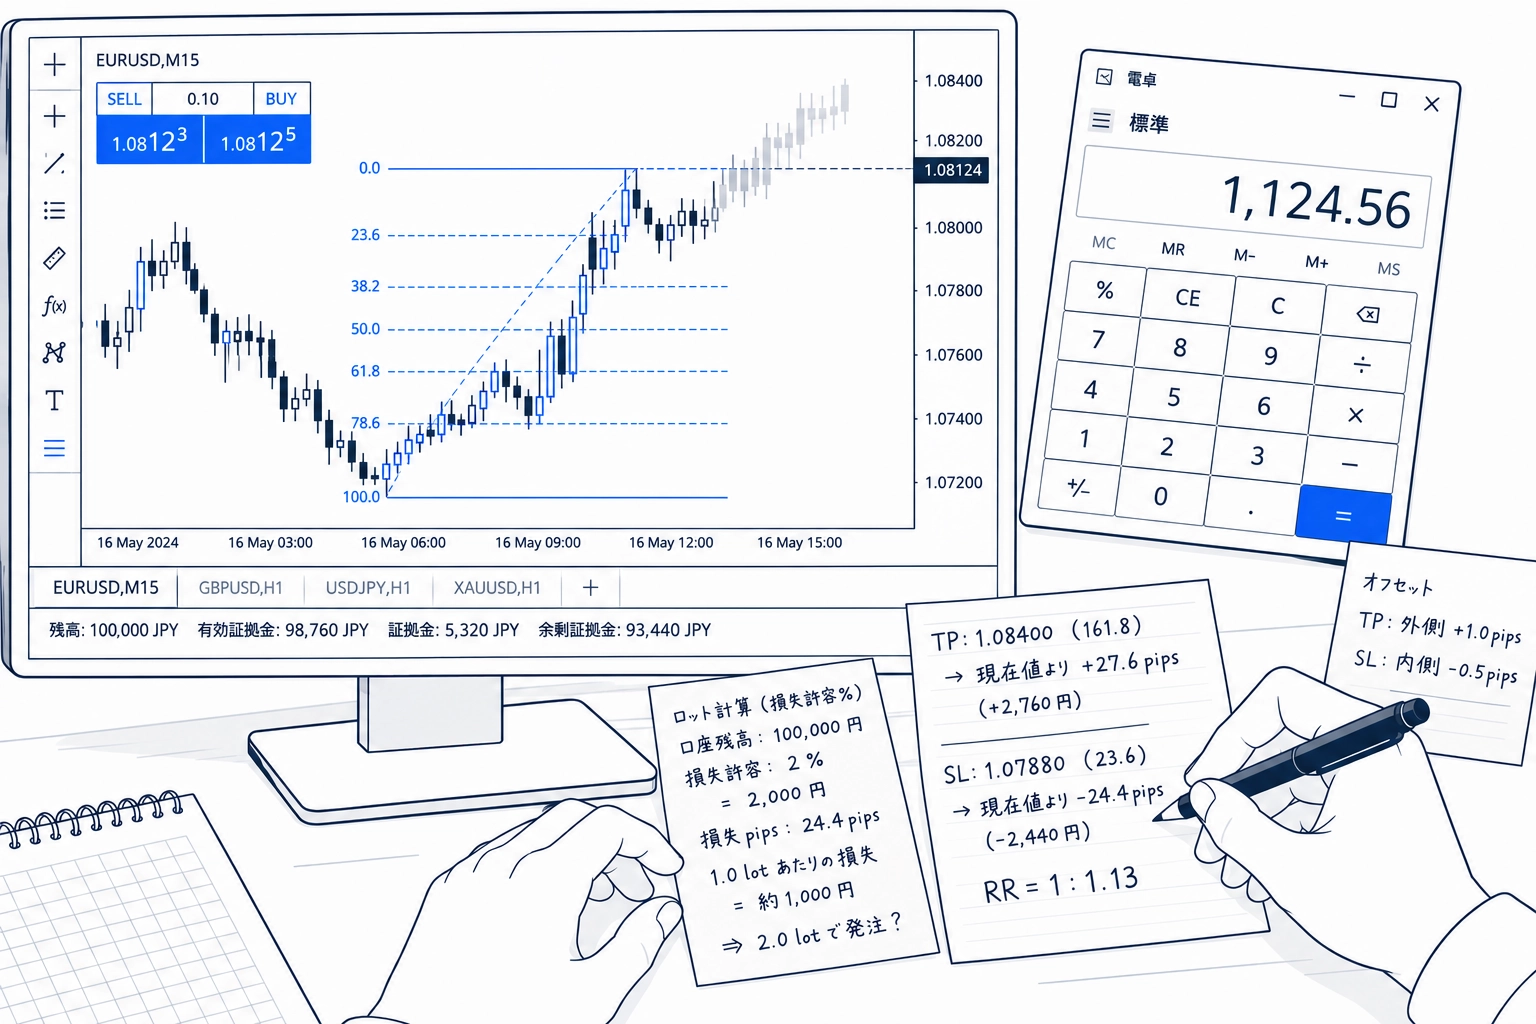
【Fibonacci Practice Notes】Part 2: Where does 61.8% come from? Why does it work.
Are you using numbers without knowing their origin
Last time I wrote about the story after drawing Fibonacci. This time, I'll go back a little.First, why these numbers in the first placeis the topic.
23.6%, 38.2%, 61.8%. These are numbers that come with MT5 from the start. For a long time, I used them without thinking about their meaning as well.
However, once you know their origin,there are times when your judgment changes.Especially when they “don’t work,” you can think about why they don’t work.
First, about sequences
The Fibonacci sequence looks like this.
1, 1, 2, 3, 5, 8, 13, 21, 34, 55, 89, 144...
If you add the previous two, you get the next one. That’s the rule. 1+1=2, 1+2=3, 2+3=5.
What’s interesting starts here.Divide two adjacent numbers.
| Division | Answer |
| 3 ÷ 2 | 1.500000 |
| 5 ÷ 3 | 1.666667 |
| 8 ÷ 5 | 1.600000 |
| 13 ÷ 8 | 1.625000 |
| 21 ÷ 13 | 1.615385 |
| 55 ÷ 34 | 1.617647 |
| 144 ÷ 89 | 1.617978 |
| 377 ÷ 233 |1.618026|
1.618approaches. This number is called the golden ratio. Precisely, it continues infinitely as 1.6180339887…
Each level is created from here
61.8% is the reciprocal of this 1.618.
1 ÷ 1.618 = 0.618
So where does 38.2% come from?0.618 squaredis calculated.
0.618 × 0.618 = 0.382
0.618 × 0.618 × 0.618 = 0.236
Also, there is a level of 78.6%. This isthe square root of 0.618.
√0.618 = 0.786
The 161.8% and 261.8% used for profit-taking are also essentially the golden ratio itself and its square.All are derived from 1.618.
However, only 50% is different
The 50% halfway back. Thiscannot be derived from the Fibonacci sequence.
In practice, no combination yields 0.5. The 50% is a rule of thumb added later, based on the experience that markets frequently retrace about halfway.
In other words,one number in the list of Fibonacci levels is not Fibonacci at all.Many people use it without realizing it.
Fibonacci also appears in nature
This sequence appears often in nature: the arrangement of sunflower seeds, the spiral of shells, tree branching. The angles at which leaves attach to the stem to avoid overlap are said to be close to the golden ratio as well.
This fact that it “appears in nature” became the trigger to bring it into markets.
Why it was brought into the markets
From here, the main topic begins.
The trigger is1938. Ralph Nelson Elliott, an American stock analyst who created the Elliott Wave Theory.
He analyzed the Dow Jones’ price movements and realized there is a rhythm to rises and falls. Then he thought:
“Many natural phenomena are governed by Fibonacci sequences.”
↓
The market is a collective result of many people's psychology.
↓
If human psychology is one of the natural phenomena,the market can be explained by Fibonacci as well.
This was the starting point.
For the sake of clarity,this is a hypothesis.It has not been proven. It’s a fairly bold notion that “nature is that way, so the market will be too.”
As a result, it became widely perceived
I think this is the most important part.
Elliott’s hypothesis spread afterward. Many traders adopted it, chart software included it as standard,and before you knew it, people around the world were looking at the same lines.
Then, what happens?
Orders cluster at 61.8%.Because many people expect a bounce there and wait. When buying actually occurs, prices bounce. Then it’s confirmed that “it worked.” The same spot becomes notable again next time.
In other words,Fibonacci is not working because the golden ratio is a law of nature.
It works because many people are watching.That’s the key. It’s not a mathematical necessity, but ratherit became so as a consequence.
In other words, this can be thought of as
With this understanding, you can make several judgments.
① Adding your own values makes it less effective
Suppose you find “43.7% works.” However,only you are watching that. Orders don’t accumulate. Therefore, using standard values is more rational.
② It’s natural that there are times it doesn’t work
When indicators or news move prices greatly, levels break through effortlessly.In such cases, the orders from technical traders are outweighed by other forces. In other words, not working isn’t abnormal. The premise has just collapsed.
③ Higher timeframes tend to work better
Daily-levels are likely watched by everyone looking at daily charts. Those watching 5-minute levels are fewer.The difference in number of people watching may translate into how strongly it works.
About the tools I use
The FTS I usedetects and moves with MT5’s standard Fibonacci.
However, I don’t use my own drawing tools.It’s designed to use the same lines as many people are looking at.From the logic above, this is reasonable.
As you draw levels, TP and SL candidates appear, showing distance in pips and risk-reward ratio. The level structure can be configured freely, so you can use standard values as they are.
Fibonacci certainly works, but it isn’t万能. In such a case, market analysis becomes important.
This tool is optimized only for Fibonacci trading, so I can devote resources to essential market analysis.
↓ Real screen and feature details ↓
Fibonacci Trade System (product page)
Next time
In Part 3,the meaning differences of each levelwill be covered.
This time was about where the numbers come from, but next will be about how to read them. 23.6% and 61.8% have different meanings.How far back you retrace changes how you view the marketis what I will discuss.