
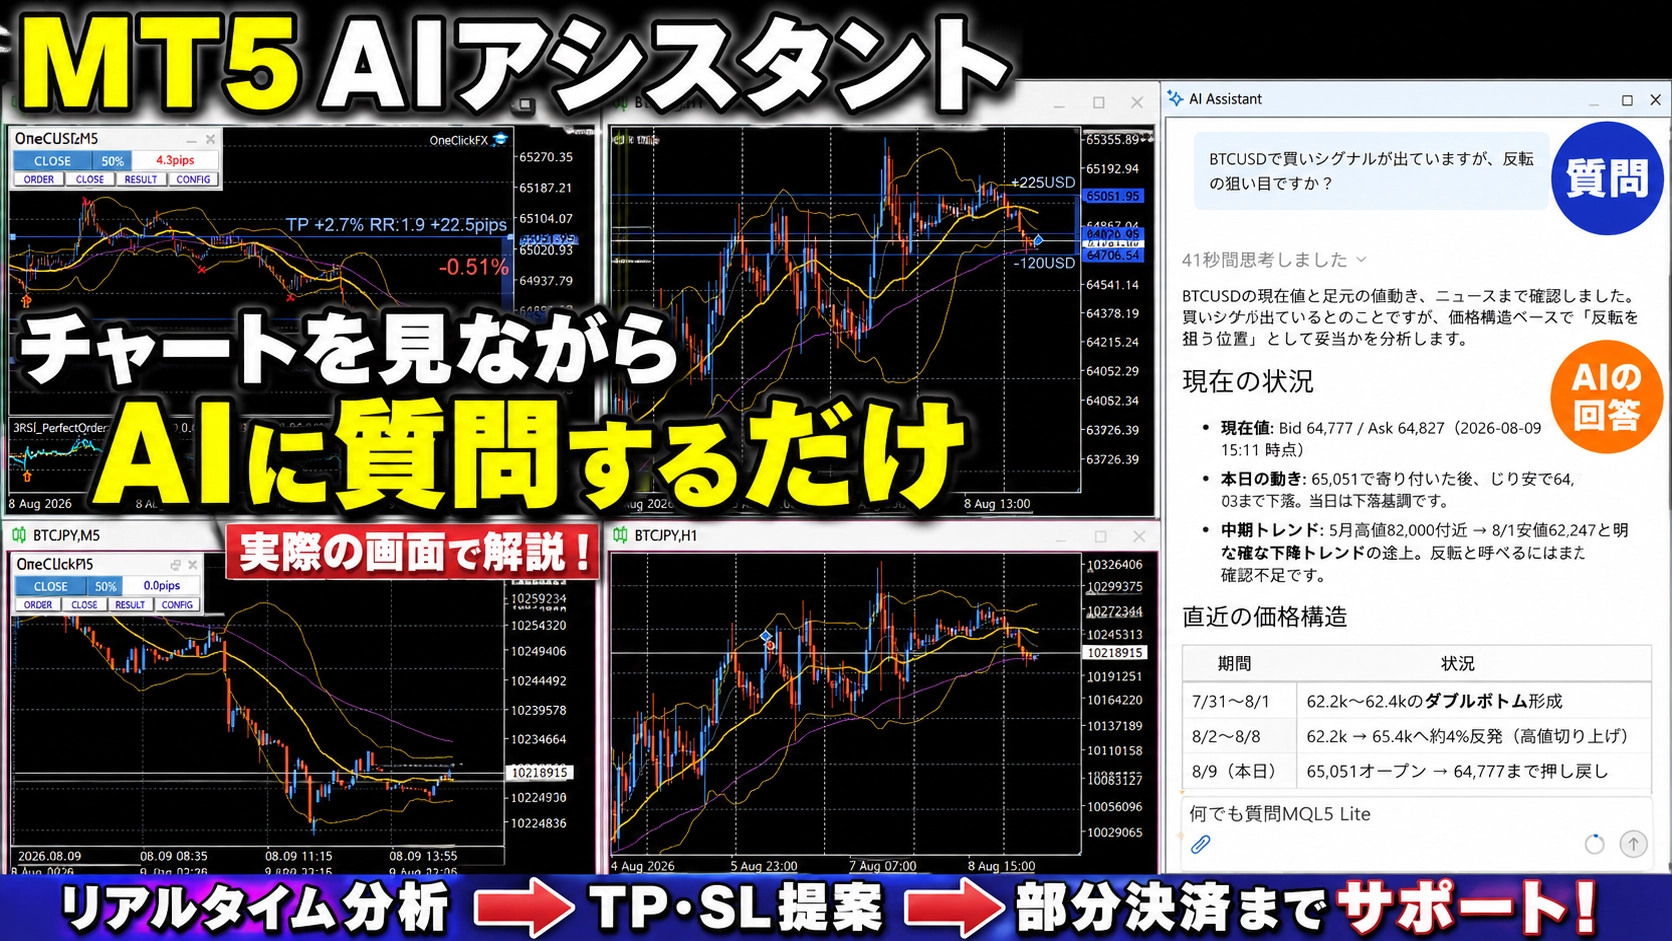
Sample free AI assistant? Does MT5 AI Assistant change FX? Moving toward an era where beginners can learn the knowledge of experienced traders
“There is a buy signal on BTCUSD. Is this a good opportunity for a reversal?”
I asked MT5’s AI assistant this kind of question. It not only checked the current price but also looked at chart movements and news, and judged it as a “pullback” rather than a “reversal.” When I asked, “If I buy 1 lot, where should I place TP and SL?” it proposed concrete levels.
At this point, the AI is no longer just a chat partner. It seems like a second eye you can consult during trading.
Actual AI assistant’s response
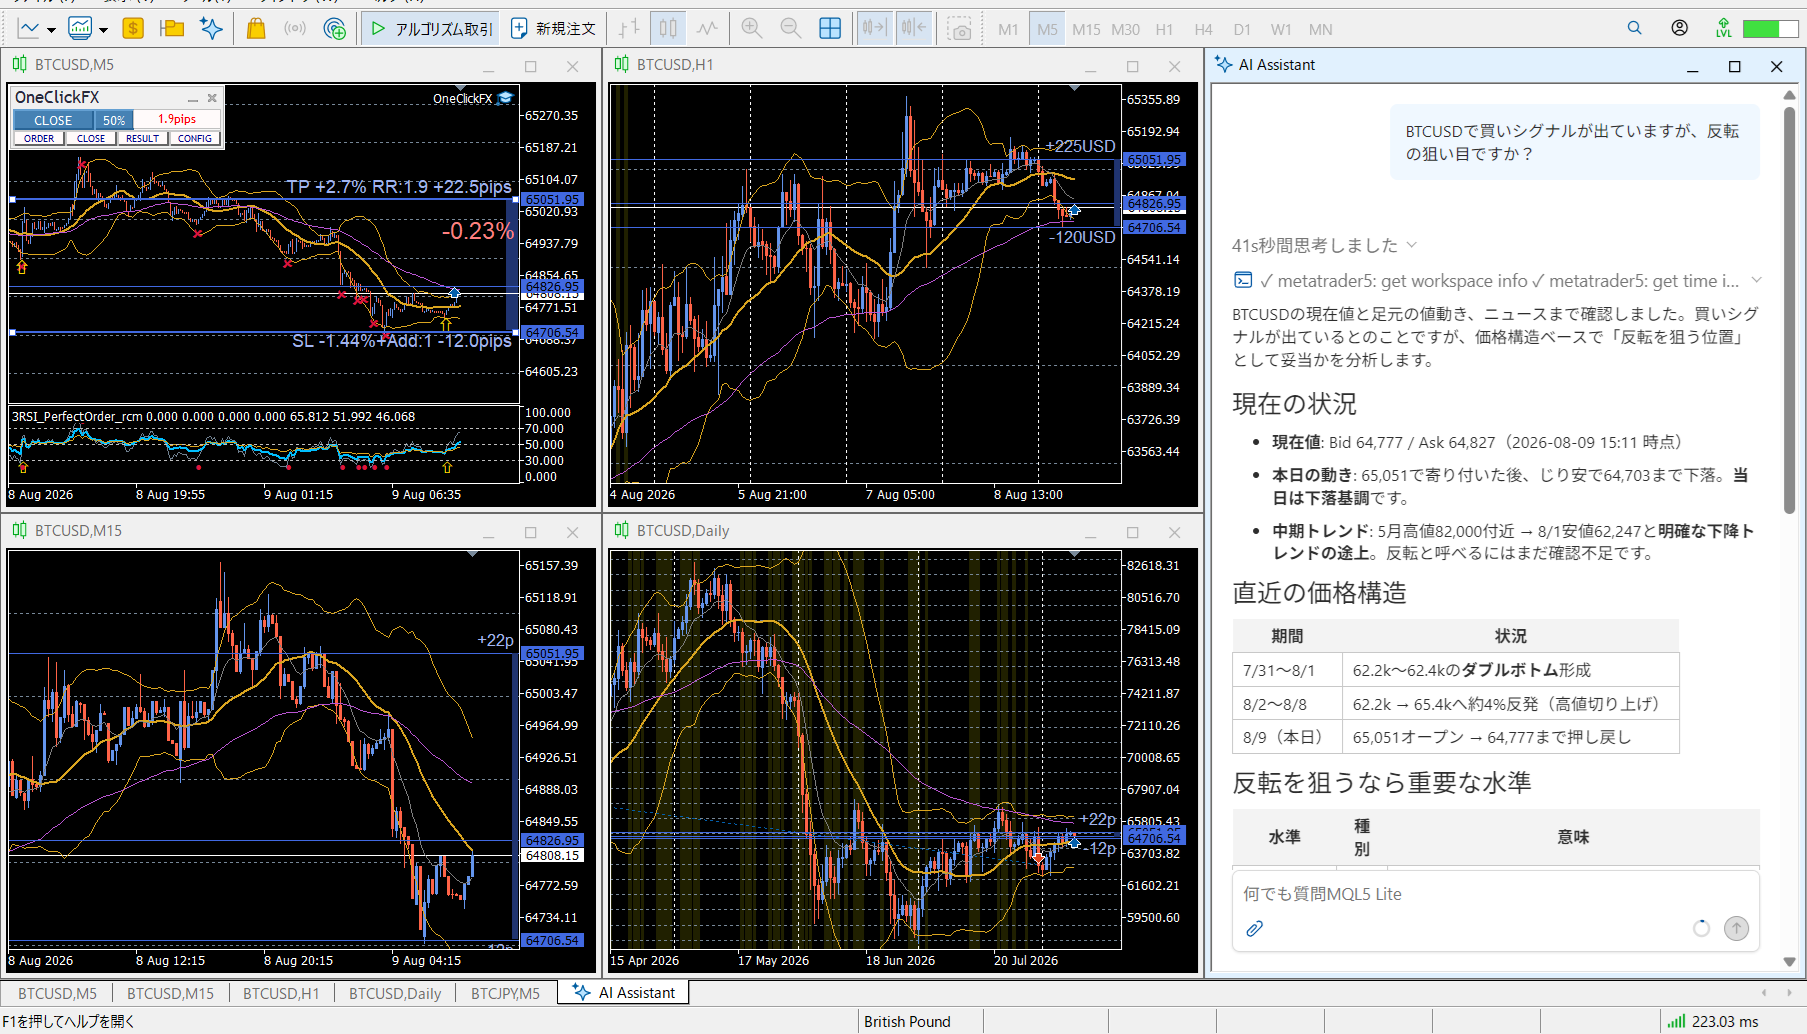
AI assistant’s answer
I checked BTCUSD’s current price, the near-term price action, and the news. It’s a buy signal, but I’ll analyze whether the price structure justifies aiming for a reversal for a position to buy.
Current situation
- Current price: Bid 64,777 / Ask 64,827 (as of 2026-08-09 15:11)
- Today’s movement: Opened at 65,051 and gradually declined to 64,703.The day’s trend is downward.
- Medium-term trend: May high around 82,000 → Aug 1 low 62,247, indicating a clear downtrend. It’s not yet confirmed as a reversal.
Recent price structure
| Period | Situation |
|---|---|
| 7/31–8/1 | 62.2k–62.4kDouble bottomformed |
| 8/2–8/8 | 62.2k → 65.4k rebound of about 4% (higher highs) |
| 8/9 (today) | Open at 65,051 → pullback to 64,777 |
Important levels if aiming for a reversal
| Level | Type | Meaning |
|---|---|---|
| 65.0k–65.4k | Resistance | Highs from 8/7–8/8.Clear breakout above this would be the first confirmation of a reversal |
| 66.4k–67.0k | Resistance | Highs from 7/21–22. A breakout here would be a more solid reversal signal |
| 64.0k–64.2k | Support | Lower bound of the recent H1 range |
| 63.3k–63.5k | Support | Pullback level from 8/4–8/5 |
| 62.2k–62.7k | Support | Double bottom from 7/31–8/1. Final line before reversal |
Conclusion: The current buy signal is mid-range as a reversal target
To be honest,the area around 64.8k is between support and resistance, so the risk-reward of entering on a reversal is not favorable. Reasons:
- Today is a down day, and after the signal appeared, prices kept falling → timing may be premature
- If 64.7k breaks on the H1,a gap opens down to 63.3k–63.5k.
- There is nearby resistance around 65.0k–65.4k; even if price reverses,it may hit a wall soon
If aiming for a reversal, two higher-probability patterns are:
- Pattern A (trend-following reversal): a pullback to 63.3k–63.5k (or 62.2k–62.7k) with a bullish confirmation (lower wick, bullish candle) before buying
- Pattern B (break confirmation): break clearly above 65.0k–65.4k on a closing basis, and aim for 66.4k–67kas a target; push past 65.0–65.4k is a sign of reversal
Note: News includes the BIP-110 fork dispute and miner selling pressure as weak factors, but there is also strong factor: ETF inflows of $1.1B in a week (highest since April), so direction is not set. Also this instrument hasa swap of ±2,624 USD per lot, per day, so holding to await a reversal incurs costs. Consider day-trading or using a swap-free account.
If you tell me your signal (indicator name or conditions), I can validate its accuracy and its effectiveness at the current level in detail.
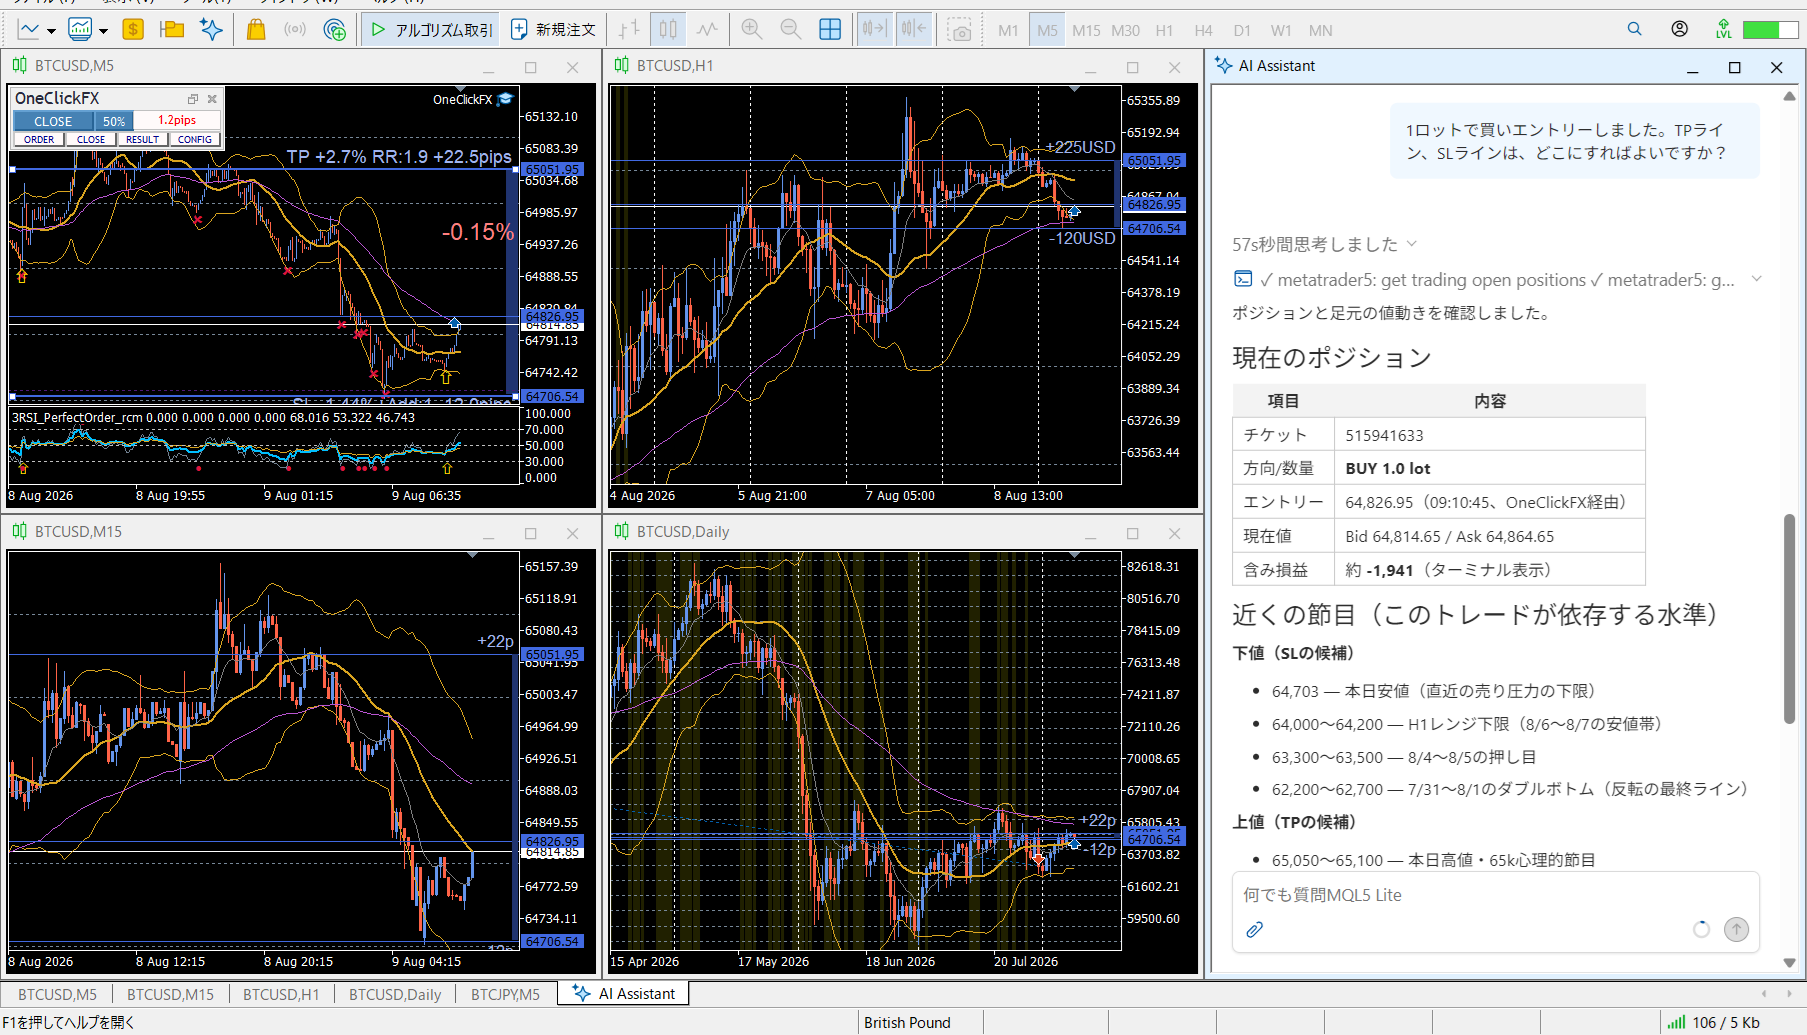
AI assistant’s answer
I checked the position and near-term price action.
Current position
| Item | Details |
|---|---|
| Ticket | 515941633 |
| Direction/Quantity | BUY 1.0 lot |
| Entry | 64,826.95 (09:10:45, via OneClickFX) |
| Current price | Bid 64,814.65 / Ask 64,864.65 |
| Unrealized P&L | Approximately-1,941(terminal display) |
Nearby milestones (levels this trade relies on)
Lower side (SL candidates)
- 64,703 — today’s low (lower bound of recent selling pressure)
- 64,000–64,200 — lower bound of H1 range (8/6–8/7 low area)
- 63,300–63,500 — pullback on 8/4–8/5
- 62,200–62,700 — double bottom of 7/31–8/1 (final line before reversal)
Upper side (TP candidates)
- 65,050–65,100 — today’s high; 65k psychological level
- 65,370 — 8/7 high
- 66,400–66,900 — 7/21–22 high zone
- 68,000–70,000 — last week’s bullish target zone
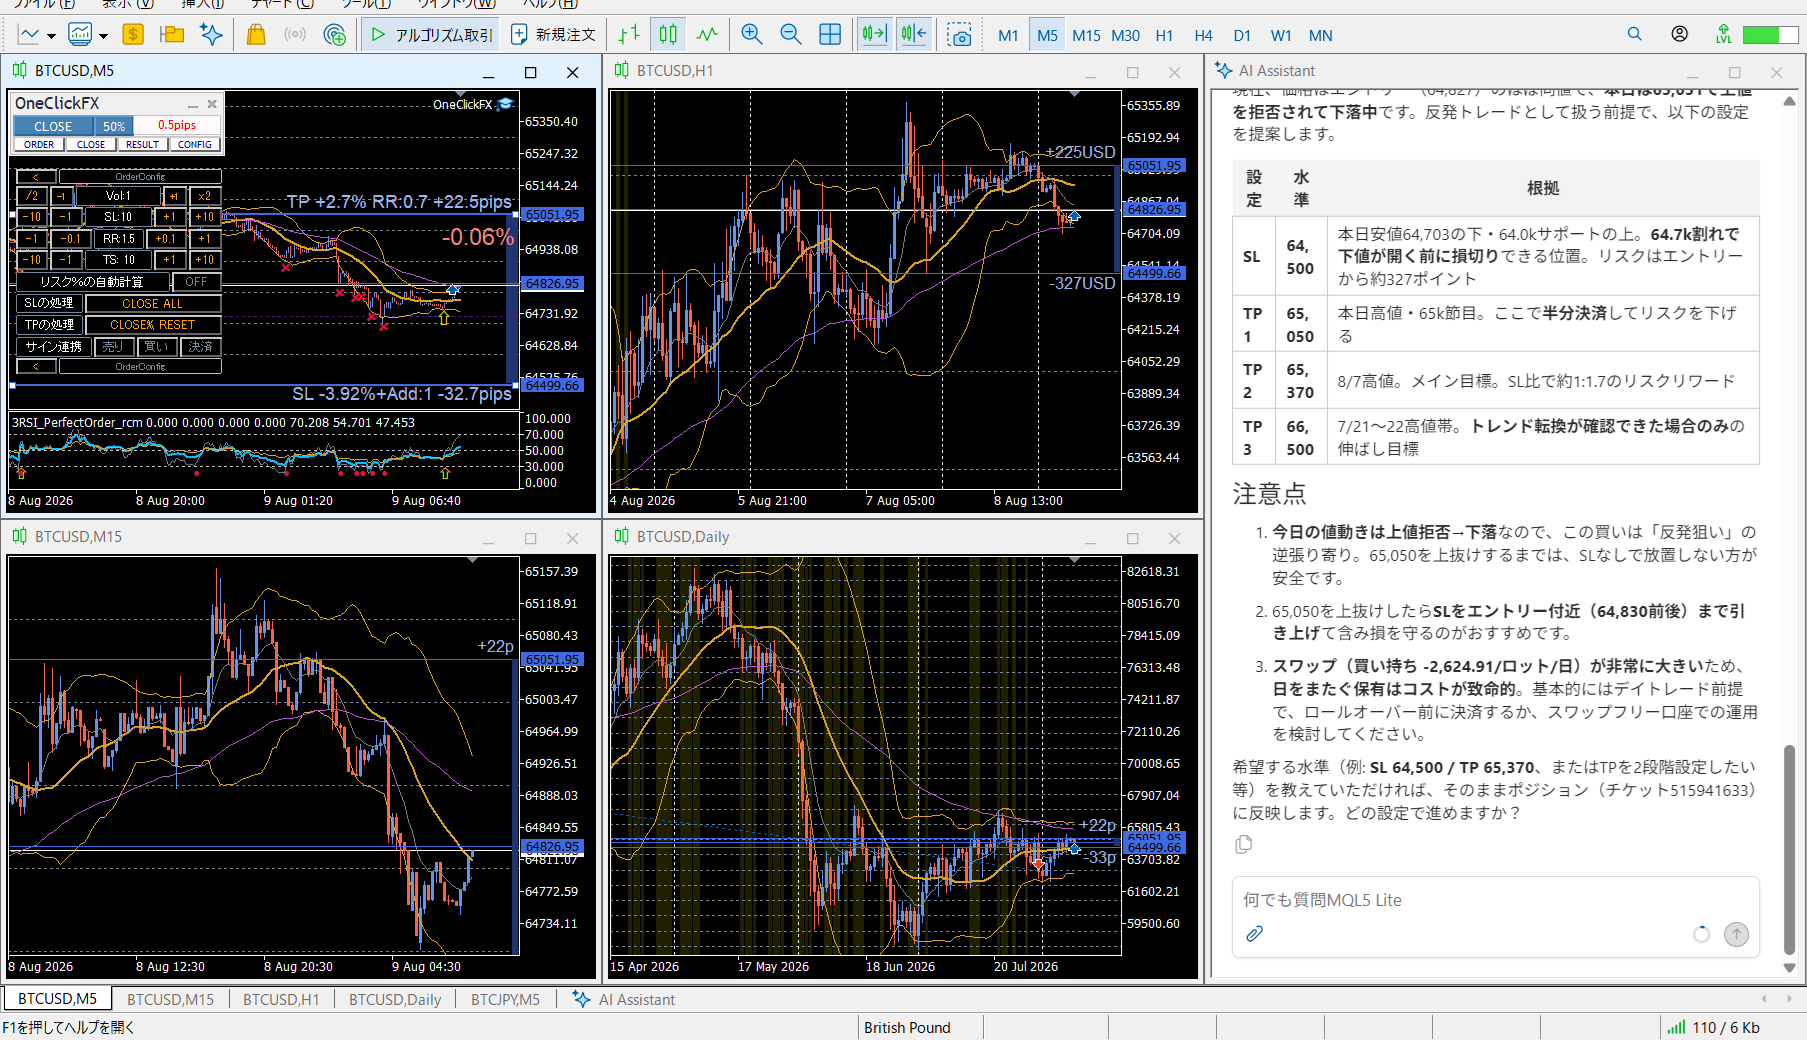
Recommended settings
Currently, price is almost at the entry level (64,827),today price rejected higher and is dropping at 65,051. Assuming you treat this as a rebound trade, I propose the following settings.
| Setting | Level | Rationale |
|---|---|---|
| SL | 64,500 | Below today’s low 64,703 and above the 64.0k support.If price falls below 64.7k, cut losses before the downside opens. Risk is about 327 points from entry. |
| TP1 | 65,050 | Today’s high and 65k key level. Here,half-closeto reduce risk. |
| TP2 | 65,370 | 8/7 high. Main target. Risk-reward around 1:1.7 compared to SL |
| TP3 | 66,500 | 7/21–22 high zone.Only if a trend reversal is confirmed, to extend target. |
Cautions
- Today’s price action shows rejection of higher price → downwardSo this buy is a contrarian rebound play. Until price clears 65,050 on a breakout, avoid leaving SL unset for safety.
- If price closes above 65,050Move SL up toward entry vicinity (around 64,830)to protect unrealized loss.
- Swaps are very large (buy hold -2,624.91 per lot per day), so holding across days is costly.
If you have a preferred level (for example: SL 64,500 / TP 65,370, or you want two-phase TP), tell me and I will reflect it in the position (ticket 515941633) as is. Which setting should we proceed with?


Practice and validate freely with a completely risk-free trade simulator!
One Click FX training details page