

Limited-time discount: An indicator that quickly identifies turning points in the market!
Are you struggling to get that “one more step” in trading?
This indicator eliminates the hassle of tracking multiple indicators and provides entry points with a clear criterion of “line crossing.”
It is designed so that anyone can increase the number of “confident 1-click” decisions.
First, see the most recent performance reports!
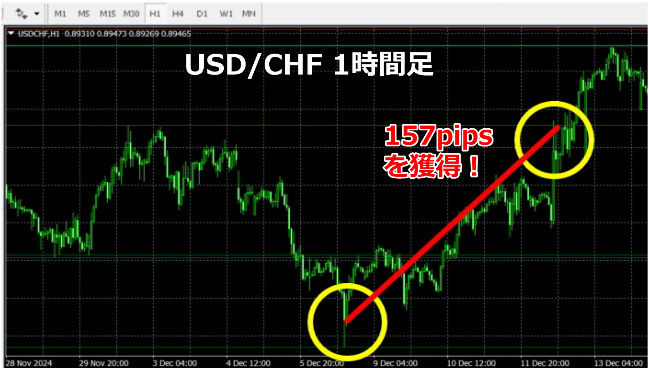
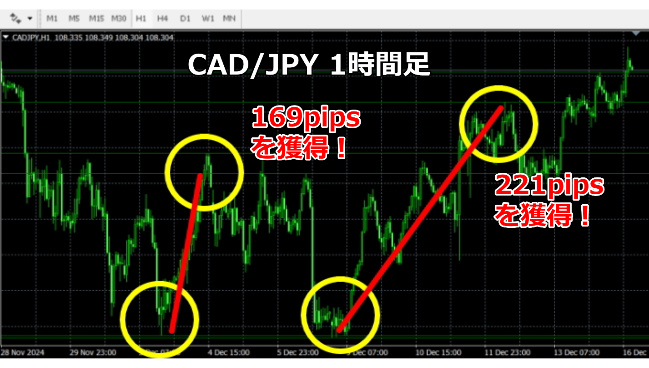
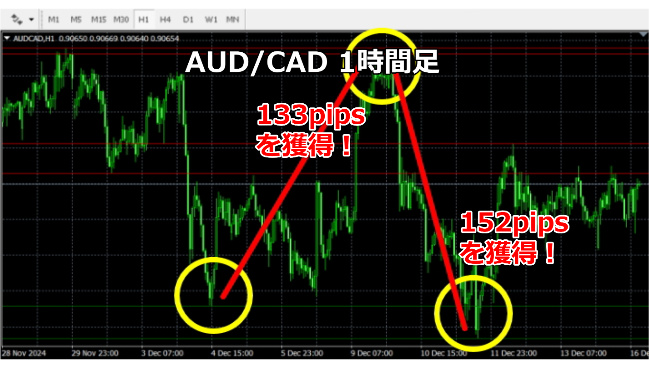
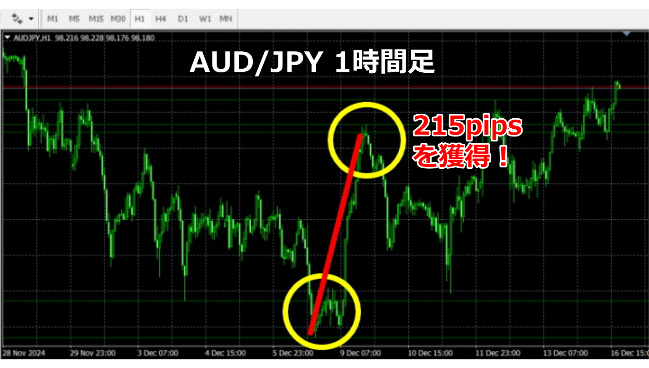
Purchase here ↓
https://www.gogojungle.co.jp/tools/indicators/41737
*This product is available to online community members only*
*On November 24, 2023, the product version was upgraded. The upgrade included: added alert function.
Popup alerts, email notifications, and mobile notifications are available.

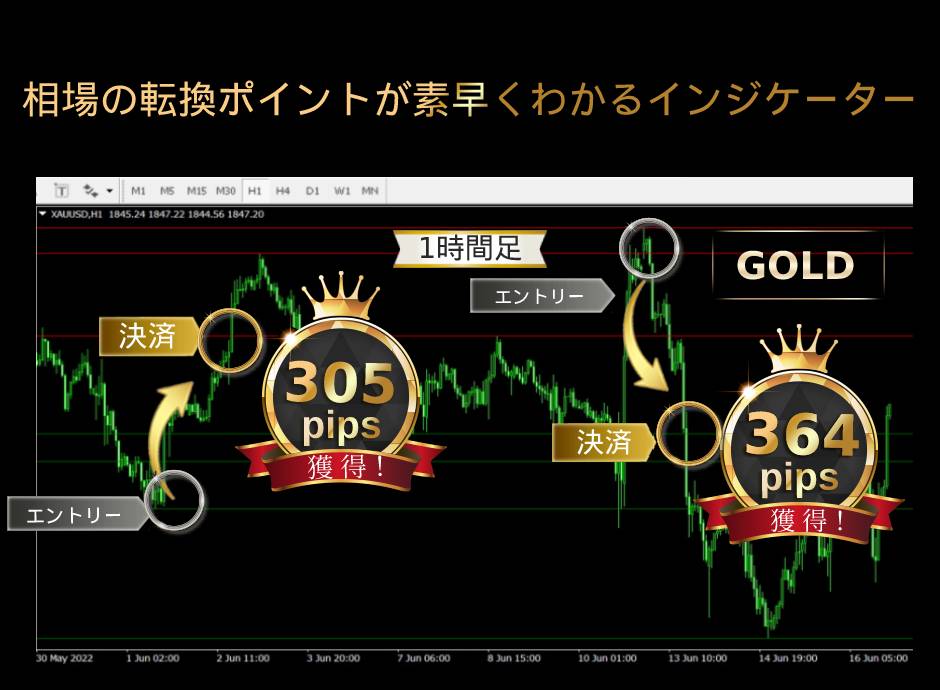
This is an indicator that quickly identifies turning points in the market. It automatically displays important resistance and support lines where the market tends to reverse.
Features of the Indicator
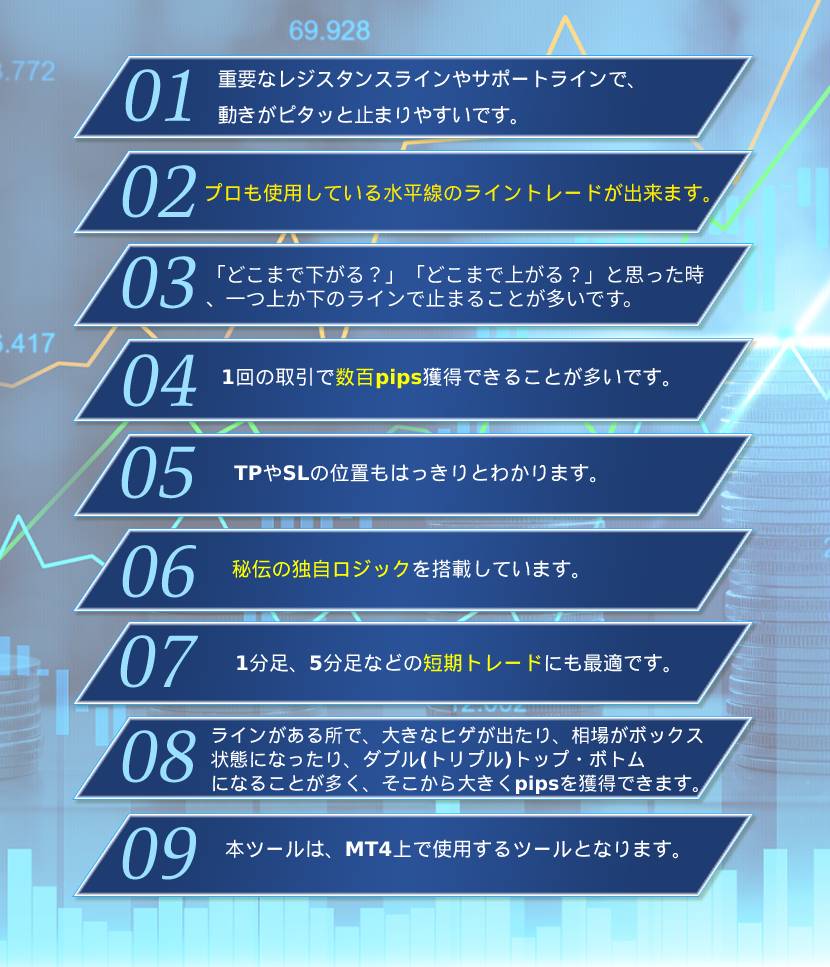
This indicator has been validated across all timeframes and major currency pairs, to ensure it provides stable signals in any market condition.
Moreover, the chart operation is very light,and you won’t feel much load even when monitoring multiple currencies simultaneously.
By eliminating signal misalignment and freezes due to delays, you can trade confidently across multiple windows.
Additionally,backtesting continually records realized pips and win rate trends, confirming stable performance not reliant on a single good result.
Accumulated practical data supports the reliability of this tool.
How to use the indicator
EUR/AUD 1-hour
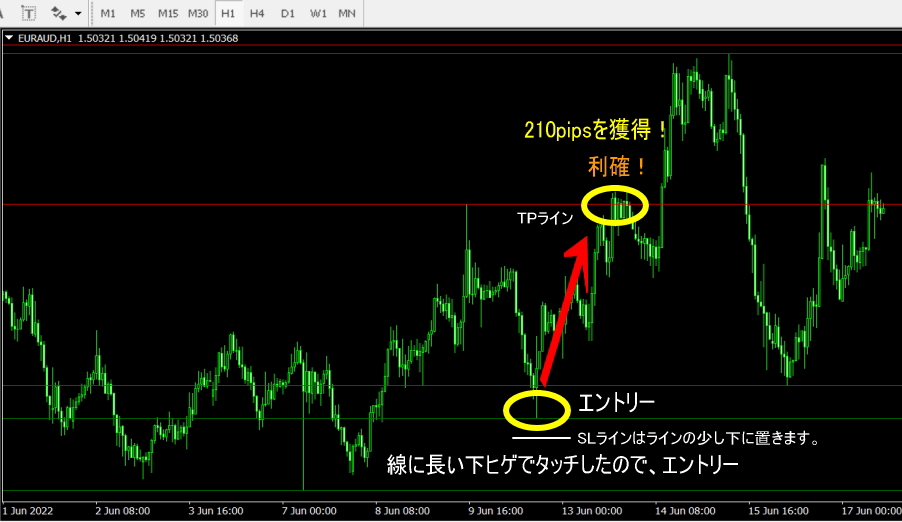
EUR/AUD 1-hour
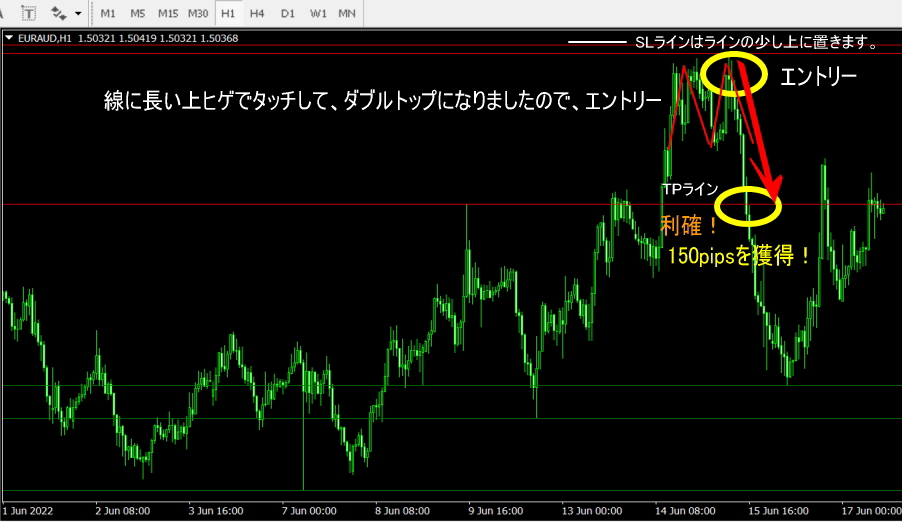
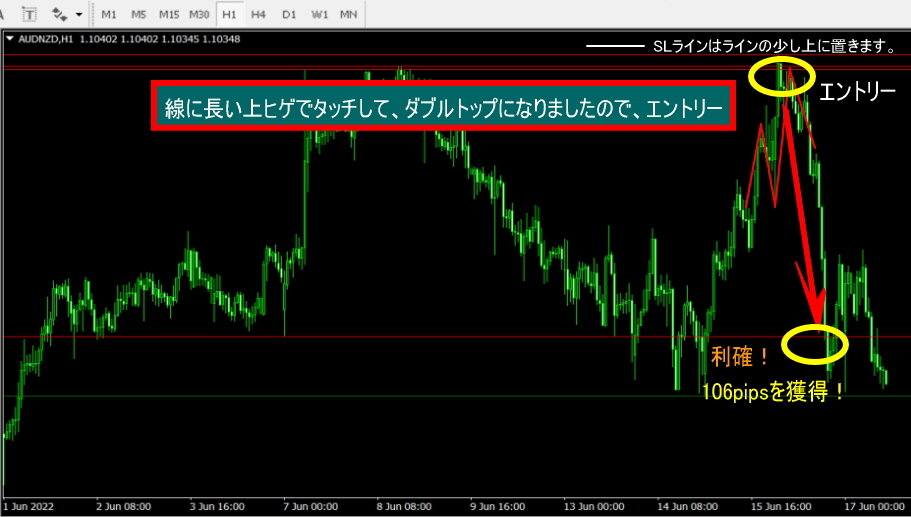
AUD/NZD 1-hour
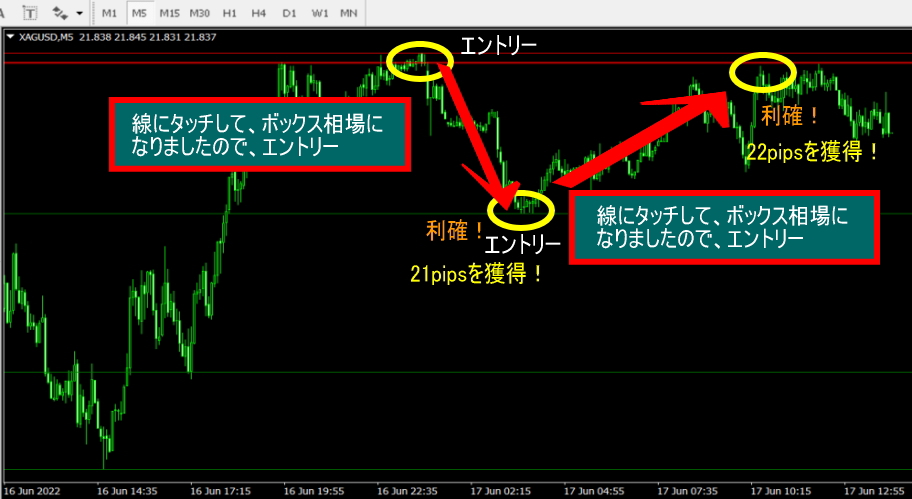
XAU/USD 5-minute
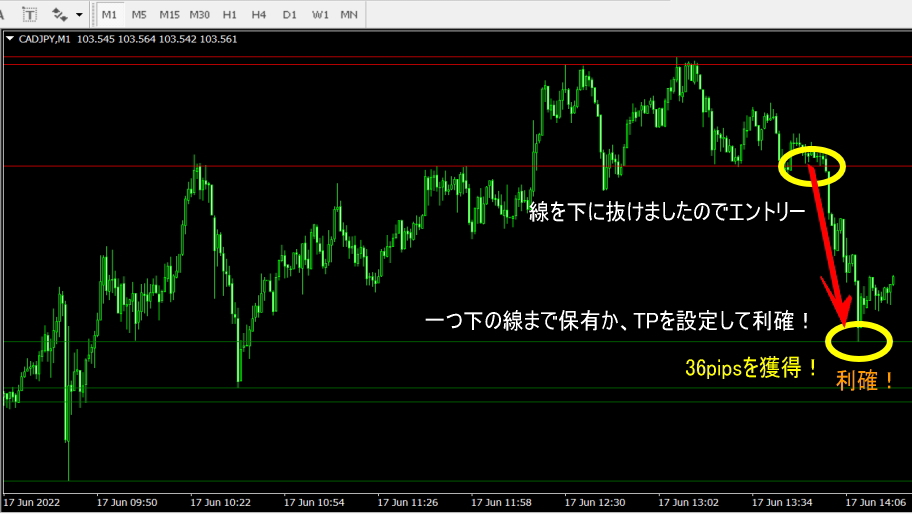
CAD/JPY 1-minute
About the contents of the indicator
Introduction of SR lines/indicator
Main productsrlines.ex4to MT4’sIndicatorsfolder, then restart MT4 and drag onto the chart to use.installation is completed in minutes.
Automatically visualize the levels the market pays attention to
The lines drawn by this indicator represent levels that tend to react as turning points in real markets.When price approaches these levels, you often observe a pause, reversal, or shift in momentum,which helps in making buy-the-dip/sell-the-rally/bounce-target decisions.Helpful for decision-making.
Designed so that even beginners can reproduce the skillful use of horizontal lines (line trading) that experienced traders rely on, showing visually where price is likely to stop or begin moving from. It demonstrates the visual basis for “where price tends to stall” and “where it tends to move from.”
Clarifying the “start points” of Rebounds and Breakouts
The lines function as high-probability support/resistance zones. When candles touch these lines, you often see long wicks, temporary box-like consolidation, or double/triple tops bottoms. These patterns frequently signal a directional change, and recognizing them can create opportunities for gains of dozens to hundreds of pips.
Note that results vary with market conditions and timeframes.Past data are indicative, not a guarantee of future profits.
Clear targets for taking profit and stopping loss
Where to take profits and where to retreat are crucial points that determine profitability. SR lines visualize levels that serve as TP (take profit) / SL (stop loss) targets, making it easier to plan with risk-reward in mind. By adjusting line color and thickness, you can intuitively manage priorities such as “strong resistance zone / mild pullback line.”
“Legendary logic” for line extraction that doesn’t rely on subjectivity
Instead of simple high/low extractions, it considers volatility over a set period and the distribution of price ranges to depict attention zones where market participants are drawn. This enables objective, mechanical line recognition without human bias.
Flexible trading styles from 1 minute to 4 hours
This indicator supports short-term timeframes like 1-minute, 5-minute, 15-minute, as well as mid-term 1-hour and 4-hour charts. It reliably draws on major pairs like USD/JPY, EUR/USD, GBP/JPY, gold, etc., and offers flexible operation adjusted to currency and timeframe.
“Winning patterns” near the lines
Around the lines or just before/after them, rebounds with long wicks, small ranges, and double (triple) tops/bottoms are common, and a breakout or reversal can lead to large price swings.
Even when you’re unsure how far price will fall or rise, stopping at the next higher (or lower) line is common, forming the basis of your strategy.
Light and smooth on MT4
This tool runs on MT4 (MetaTrader4). With a design that minimizes drawing load, it remains responsive even when monitoring multiple charts. It minimizes chart stuttering and signal delays, supporting stable operation.
Summary: Build reproducibility with lines rather than relying on intuition
This indicator is not a tool to perfectly predict market tops and bottoms. However, by pre- identifying levels where price tends to pause or begin moving, it helps remove hesitation and enables reproducible decision-making with lines as criteria that keep you from being swayed by emotions. It leads to line-based trading with clear SR line benchmarks on your chart.
* The content on this page is based on historical verification and observation and does not guarantee future profits. Results vary with market conditions, time of day, and liquidity.
Purchase here ↓
https://www.gogojungle.co.jp/tools/indicators/41737
After purchase, for downloading this product, please check the site below.
→https://www.gogojungle.co.jp/post/1/15817
Also, please check the site below for how to install the indicator.
→https://www.gogojungle.co.jp/post/1/8212