Temporary version: Integrate MT5 AI Assistant with AI Judgement
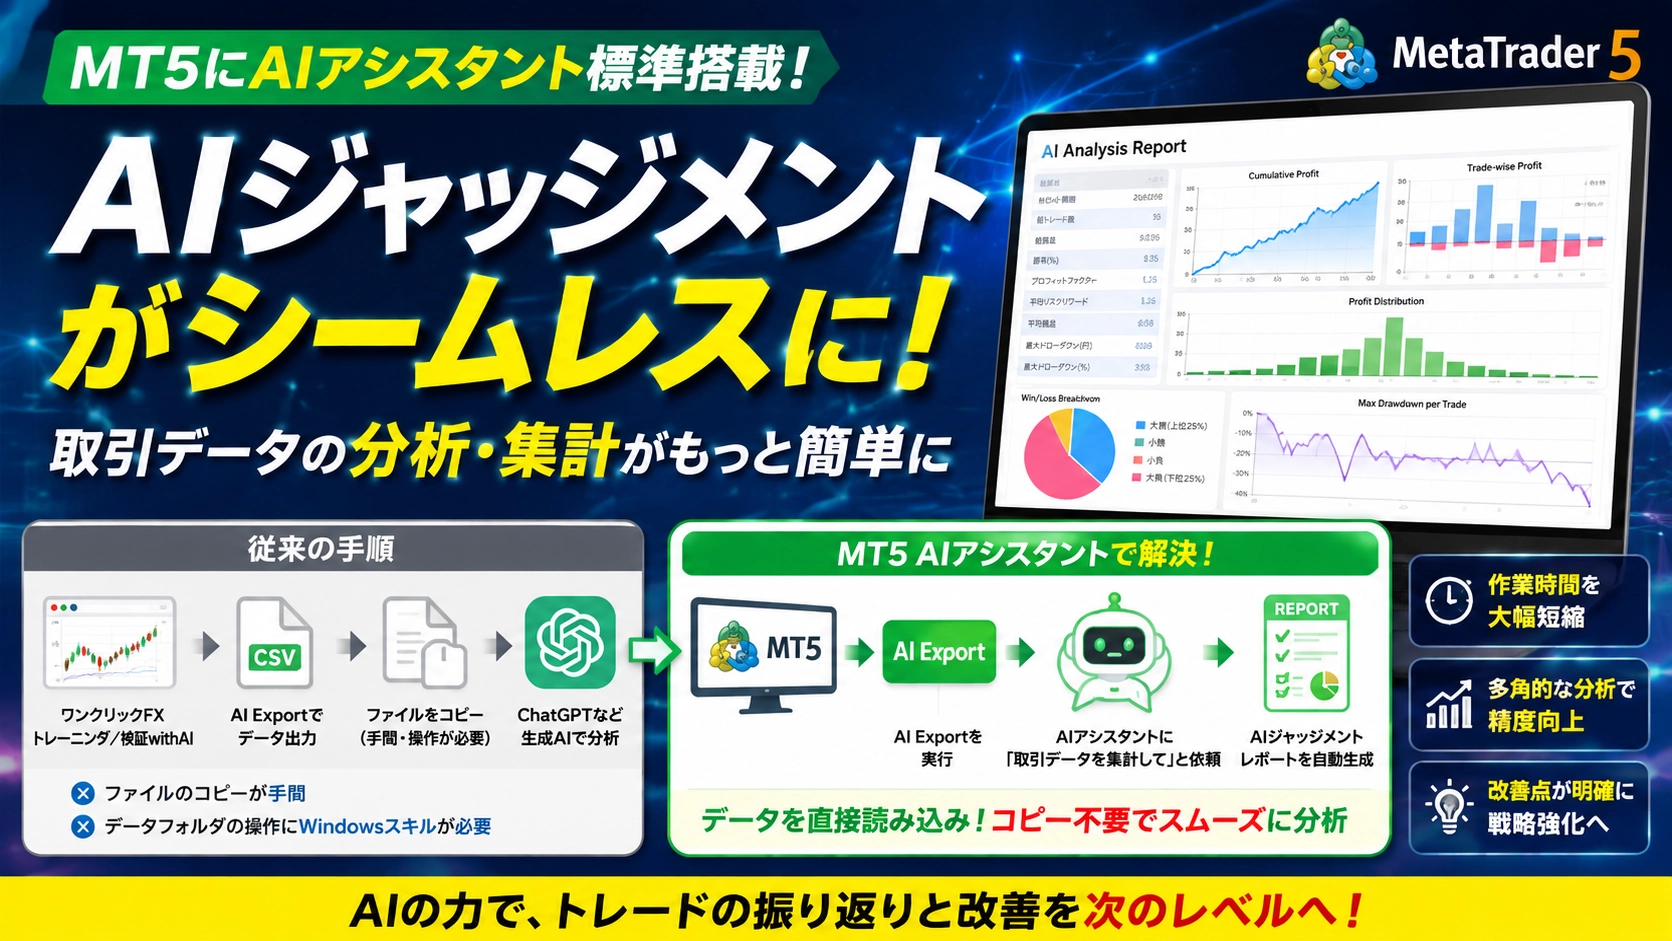
With the standard integration of MT5's AI Assistant, you can use AI Judgment more smoothly.
Changes from the conventional
Previously,One-Click FX TrainingandOne-Click FX Verification with AIexported trading data via AI Export, pasted that data file into generation AIs such as ChatGPT for analysis and aggregation.
This required the extra step of copying files and, since the data was inside a data folder, it also required Windows operation skills.
However, with this MT5 AI Assistant, you can directly read the trading data output by AI Judgment, so there is no need to copy files.
Basic structure
After pressing the AI Export button, simply request the AI Assistant to “summarize the trading data,” and it will generate an analysis report using AI Judgment.
However, there are several steps, so this prompt has been adjusted for MT5 AI Assistant compatibility.
The following prompts, which have long been used, remain the basis, and the aggregation method remains unchanged.
 【GPT5 Compatible】AI Judgment: A Prompt to Analyze FX Automated Trading Tools in One Go
Regarding the output format of graphs, MT5 AI Assistant cannot directly generate PNG images, so it has been changed to a more versatile format such as SVG.
Additionally, considering the behavior characteristics of MT5 AI Assistant, certain conditions have been applied.
✨Contents of the Auto-analysis Prompt
The performance of automated trading will be analyzed in avisual and quantitative manneras follows.
【Step 1: Statistical Summary】
Quantify each item numerically.
- Trading period (start to end)
- Total trades, total profit and loss
- Winning trades + win profit, losing trades + loss
- Win rate (%)
- Profit factor (PF = total profit / total loss)
- Average risk-reward (average win / average loss)
- Average P&L (total P&L / number of trades)
- Average pips (only if the instrument is identifiable; specify the pip value if calculated; if unknown, state that it cannot be calculated)
- Maximum drawdown (in yen and in %). Define as absolute drop from peak to trough in the cumulative P&L curve and from peak to subsequent bottom in percentage, and note the definitions)
【Step 2: 5 Graphs with Comments】
Output the following graphs directly in the HTML as SVG or vanilla JS (Canvas, no external libraries). Graph texts (titles and axis labels) should be in English alphanumeric characters. Provide brief Japanese comments under each graph.
- Cumulative Profit: Cumulative P&L over time
- Trade-wise Profit: Profit bars per trade
- Profit Distribution: Distribution of profits/losses (with KDE)
- Win/Loss Category Breakdown: Pie chart for four categories — big win, small win, small loss, big loss
- Max Drawdown per Trade: Drawdown trend per trade's unrealized P&L
【Step 3: AI Judgment (3 aspects, A-C)】
Evaluate each of the following three aspects with A–C and provide brief comments for each.
- Stability of win rate (based on Step 1 and Step 2 distributions)
- Volatility handling capability (based on price movement in bars.csv and relation to trade P&L)
- Risk management (risk controls, lot size, drawdown, average holding time, etc.)
【Step 4: Issues and Improvement Suggestions】
Provide three concrete improvement points based on the analysis results in the following format.
✅Execution Result Image (Partial)
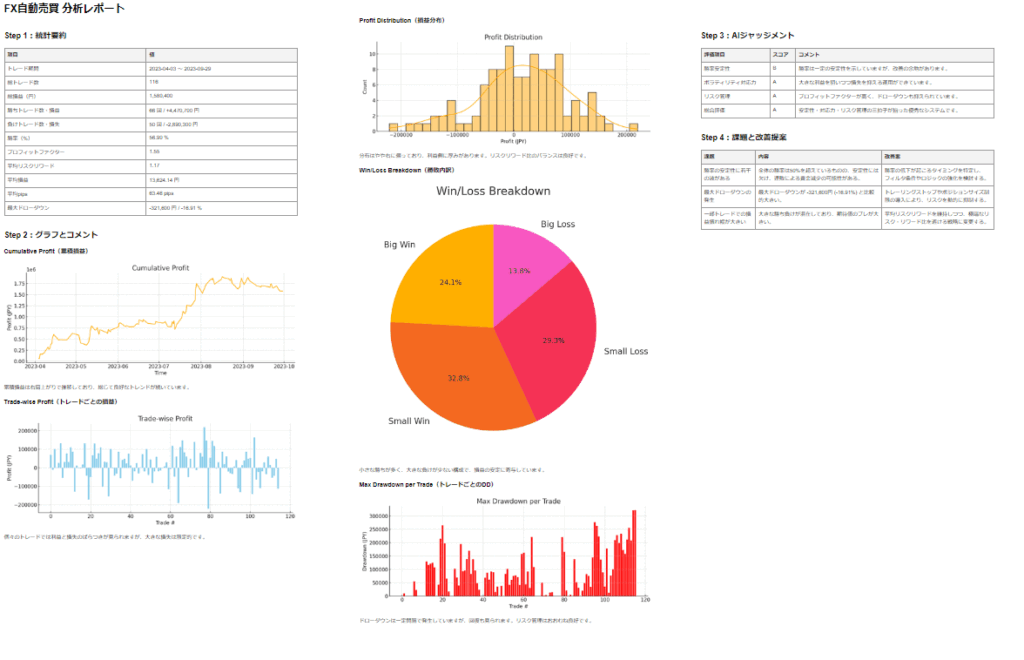
Sample Report
Note: The report is created from assorted trading data, so please overlook the actual trades.
MT5 AI Assistant:Report_20260802_013500
Claude sonnet5:Report_20260801_164937
Grok 4.5:Report_20260802_021400
ChatGPT:FX_Analysis_Report_v2(Could not generate to the end due to long-output restriction)
?Full Prompt
Please copy the following prompt into MT5 AI Assistant, ChatGPT, Claude, or other generation AI. If you run it with a CSV file attached, an AI-generated analysis report and graphs will be displayed on the screen. When using the MT5 AI Assistant, the Files/Export4AI will be read, so no attachment is necessary.
You are an FX automated trading analysis assistant.
Read two CSV data files (trade history and time-series chart) and output a single HTML report in one file.
Draw graphs directly in HTML using SVG or vanilla JS (Canvas, no external libraries). Do not image-ize or base64-encode images.

## Input method
History.csv and bars.csv should be searched/obtained in the following order:
1. Files directly uploaded/pasted by the user
2. (If local file system is accessible) MT5 data folder's MQL5/Files/Export4AI
3. (If local file system is accessible) MT5 common folder's Files/Export4AI
If none of the above are found and the generating AI cannot access local files (e.g., only upload), ask the user for the file save path and stop processing. If access is possible but not found in the folders above, similarly ask for the save destination.
Decide encoding automatically (e.g., UTF-16) and read accordingly.

## Input data (real column names)
history.csv (trading history)
  open time
  open price
  close time
  close price
  order type (BUY/SELL)
  order volume
  profit and loss
  swap (optional; if missing treat as 0)
  commission (optional; if missing treat as 0)

bars.csv (time-series chart: OHLCV)
  time
  open
  high
  low
  close
  volume

Note: currency pair/instrument name and timeframe/account currency are not included in the columns. If you can determine them from the filename or folder name, use that; otherwise, state "instrument unknown" and "unit unknown (account currency)".

## Step 1: Statistical Summary (Japanese)
List the following items in Japanese as “Item: Value”:
- Trading period (start to end)
- Total trades
- Total profit and loss (sum of profit and loss + swap + commission; if account currency is unknown, note that)
- Winning trades + win profit, losing trades + loss
- Win rate (%)
- Profit factor (PF = total profit / |total loss|)
- Average risk-reward (average win / average loss)
- Average profit/loss (total P&L / number of trades)
- Average pips (only if instrument identifiable; specify pip value used; if unknown, note that it cannot be calculated)
- Maximum drawdown (in currency and in %). Define as absolute drop from peak to trough in currency and percentage drop from peak to subsequent bottom in the P&L curve, and state definitions in notes

## Step 2: Graphs + Comments (5 types)
Draw directly in HTML as SVG or vanilla JS. Graph texts (titles/axis labels) in alphanumeric only. Provide brief Japanese comments under each graph.

1. Cumulative Profit: Cumulative P&L over time
2. Trade-wise Profit: Profit bars per trade
3. Profit Distribution: Profit/Loss distribution histogram (with commentary on the distribution shape)
4. Win/Loss Breakdown: Pie chart dividing big win, small win, small loss, big loss. Big win/big loss defined as top 25% by absolute profit/loss; others as small win/small loss
5. Max Drawdown per Trade: Drawdown trend per trade’s unrealized P&L

Furthermore, use bars.csv data to calculate volatility for each trade’s open time to close time interval (e.g., range of high-low) and use as root for Step 3’s “volatility handling capability.”

## Step 3: AI Judgment (all in Japanese)
Evaluate in three aspects with A–C and provide brief commentary.
- Stability of win rate (judged from Step1 and Step2 distributions)
- Volatility handling capability (based on price movement from bars.csv and relation to trade P&L)
- Risk management (judged from lot size, drawdown, average holding time, etc.)

Finally, provide overall grade (A–C) and a summary comment.

## Step 4: Issues and Improvement Suggestions (all in Japanese)
For three points, format as:
- Issue (concise headline)
- Content (problem points from analysis)
- Improvement (practical methods or approaches to implement)

## Output format: HTML (single file)
- HTML structure as described
- CSS supports Japanese fonts, 100% width, mobile-friendly
- Graphs drawn directly with SVG or vanilla JS (Canvas), no external libraries or image conversion
- All text in Japanese (only graph axes/titles in English alphanumeric)
- Do not output any extra notices or source information at the end
- If there are unknowns about data/units (instrument name, account currency, pip value, etc.), note them only at the end of the report in a dedicated comments section

## Output file save rules (when writing to filesystem)
- Do not write directly to the Export4AI folder; create a subfolder Report under it and save there
- Do not overwrite or delete existing files or folders
- File name must be unique each time (e.g., Report_YYYYMMDD_HHMMSS.html); if the name already exists, append an incremental suffix
- If local filesystem write permission is not available, return the HTML file in a downloadable form
- If there are uncertainties about permissions/save destination, do not guess or implement alternative methods; ask user to confirm and stop processing
- Do not use external APIs, tools, networks, or scripts to devise new saving methods

AI Judgment is a powerful tool to objectively review your auto-trading strategy. We will continue to introduce analysis templates and use cases, so please keep utilizing it.Practice and verify freely with a completely risk-free trading simulator!Details of One-Click FX Training
AI Judgment is a powerful tool to objectively review your auto-trading strategy. We will continue to introduce analysis templates and use cases, so please keep utilizing it.
Practice and verify freely with a completely risk-free trading simulator!
Details of One-Click FX Training