

Learn How to Create Buy/Sell Plans from a Currency Exchange Broker|Episode 23: Incorporating the Three-Wave Concept in USD/JPY Market Analysis Part 16 [Toshiro Asano]

Profile of Toshio Asano

Asano Toshirō. Having worked in Tokyo Shōkei Group's foreign exchange brokerage firms, including Toukyou Forex Co., Ltd., and at EBS (now ICAP), which boasted over 80% global market share in currency trading, he has firsthand experience of historic markets such as the Plaza Accord in 1985, the subsequent era of extreme yen strength, the bubble burst, and the euro introduction in 2000, which helped him develop his market sense. He later founded two FX trading firms and worked as a dealer for a private FX fund. Currently, he writes for the daily blog of the Investment School Group. Many supporters appreciate his clear visual works that leverage his skill in video editing.
This project is where Toshirō Asano shares his trading methods and market-sense-building know-how backed by his own experience and knowledge without holding back. In this installment as well, he will continue to analyze the most recent and future USD/JPY market and, based on that, present the optimal trading plan.
※This article is a reprint and rewrite of a March 2019 article from FX攻略.com. Please note that the market information written in the body does not reflect the current market.
Weekly chart shows waiting and watching is prudent; Daily chart reverses three signals in an instant
At the end of 2018, starting with a rate hike in the United States, markets experienced large pullbacks. In particular, the stock market showed a historic decline.
Compared with that, the USD/JPY market has fallen by about 3 yen so far, and considering that in 2017 it moved within about a 5 yen range, this can be regarded as a correction, but more than the range, the market's position is changing, and the previous bullish view must be revised. However, the short-term interest rate differential between Japan and the U.S. is not expected to shrink quickly, so downside sentiment remains limited.
Source:TradingView USDJPY chart
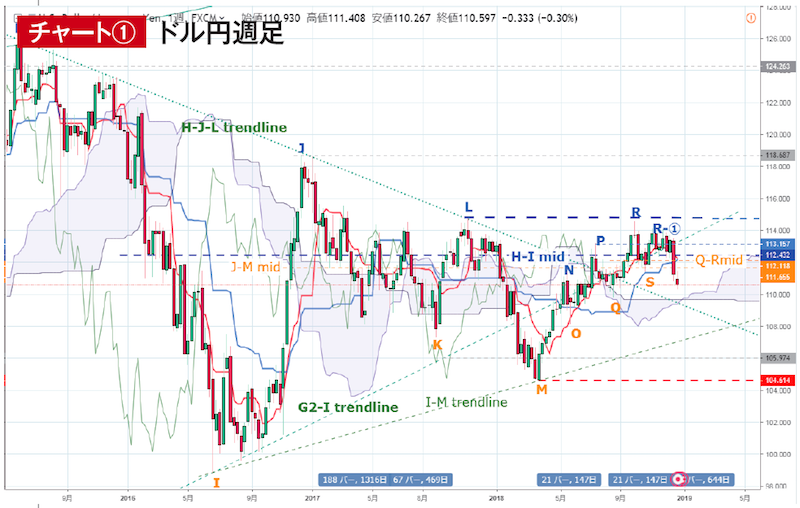
There is no particular chart adjustment this month, so we will go straight into the weekly chart (Chart 1). As of last issue, the market had maintained three favorable signals, with the price generally supported by the conversion line, and the view was on the upside. The focus was whether it would move passively along the baseline upward, but two weeks ago a sharp drop broke well below the baseline, and the recent week has traded in a range near the lows.
The target downside for the baseline has already moved to Q, and unless it is broken below, the price would remain horizontally around the current 112.16 yen, while the conversion line has already begun an active decline and is narrowly avoiding a reversal. Since the target high will gradually come down, a temporary crossing is unavoidable. A market that rebounded from the low M rose toward R while pressing with minor pullbacks, but having first fallen below the pullback S, it is natural to expect a range where Q is the maximum for a while, as indicated by the baseline.
The upper limit of the lead span, currently stretched horizontally at 109.68 yen, corresponds to M–Rmid. Since it roughly coincides with L–Mmid and the low Q as well, if the price breaks below this level and closes there, a revision of the view will be necessary.
The R–S–R①–X (X is hypothetical) three-wave pattern constitutes a decline, but since time is running out in the latest week, there is a possibility that the pullback wave could be the second wave of an M–R–T–X three-wave rise. However, the lagging span indicates that even if the market continues as is, next week’s high P will cross with the previous week’s high, so a reversal is likely to occur, which is something to watch for.
From the weekly view, the immediate downside risk has increased, making pullback buying difficult, while being above the lead span makes it against the rules to start selling dollars now, so the coming month is naturally seen as a wait-and-see period.
Source:TradingView USDJPY chart
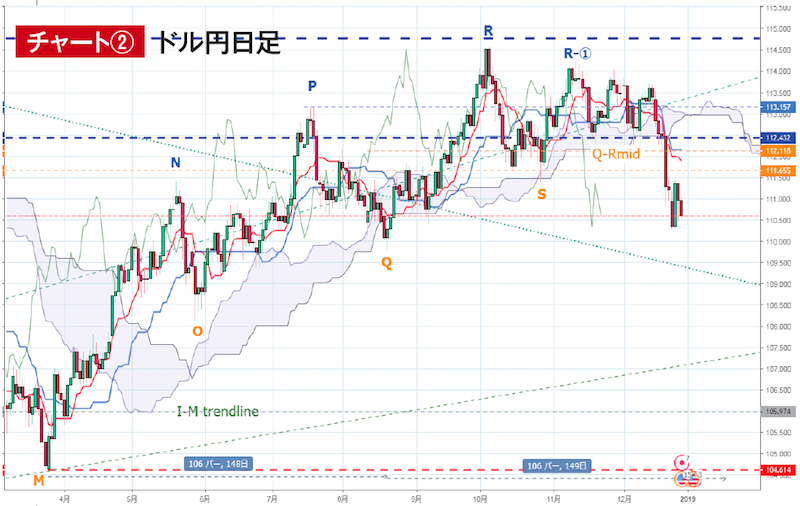
Next is the daily chart (Chart 2). Since the last issue, there have been several attempts to break below the lead span, but they were fizzled by a tail-shock and the price bounced back. It had continued to function as a strong support for a while, but on December 20, the FOMC day, it breached the level in one move, and the two turning lines were dragged down with the lead span, resulting in a triple reversal in an instant.
Since both lines moved below the lead span for the first time since the low M, the rise in the M–R wave is considered to have ended for now. After R–S, the price formed a triangular consolidation and then broke lower, a time-adjusted move that gives a very poor shape overall.


