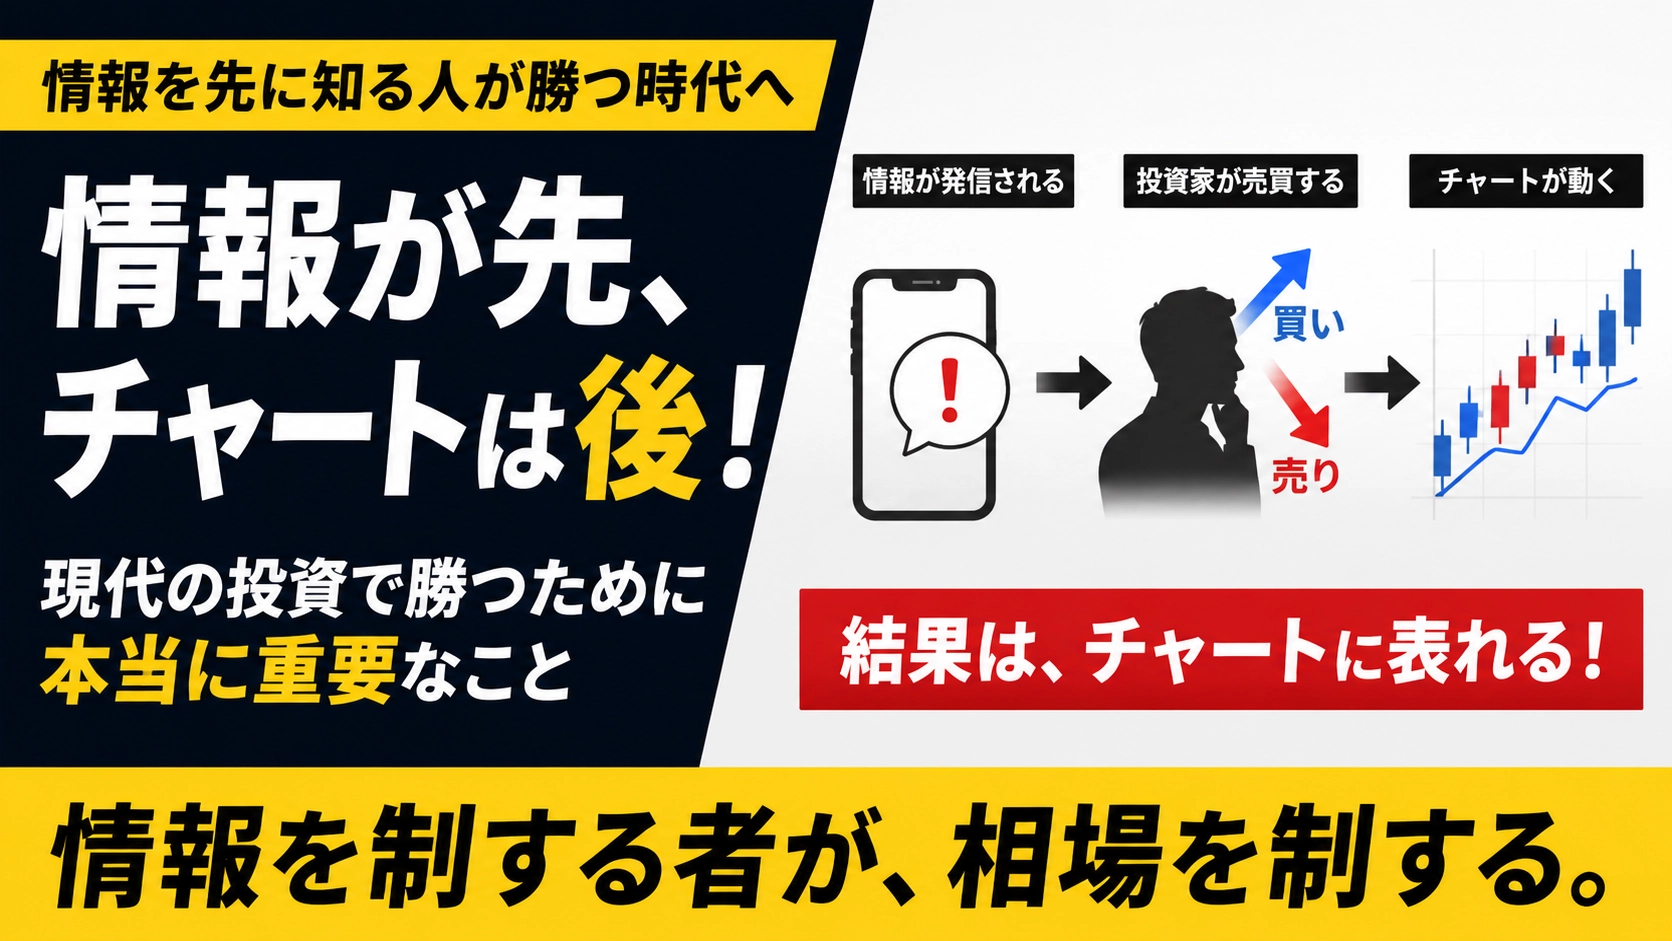
?Charts are only “results”! People who win in investing are looking at information
“If you only look at the charts, you think you can win, right?”
For example, if President Trump said he would raise tariffs on Japan by 50%, many investors would consider selling yen or Japanese stocks. Similarly, releases of employment statistics, policy interest rates, or comments by the finance minister or central bank governor can move the market significantly.
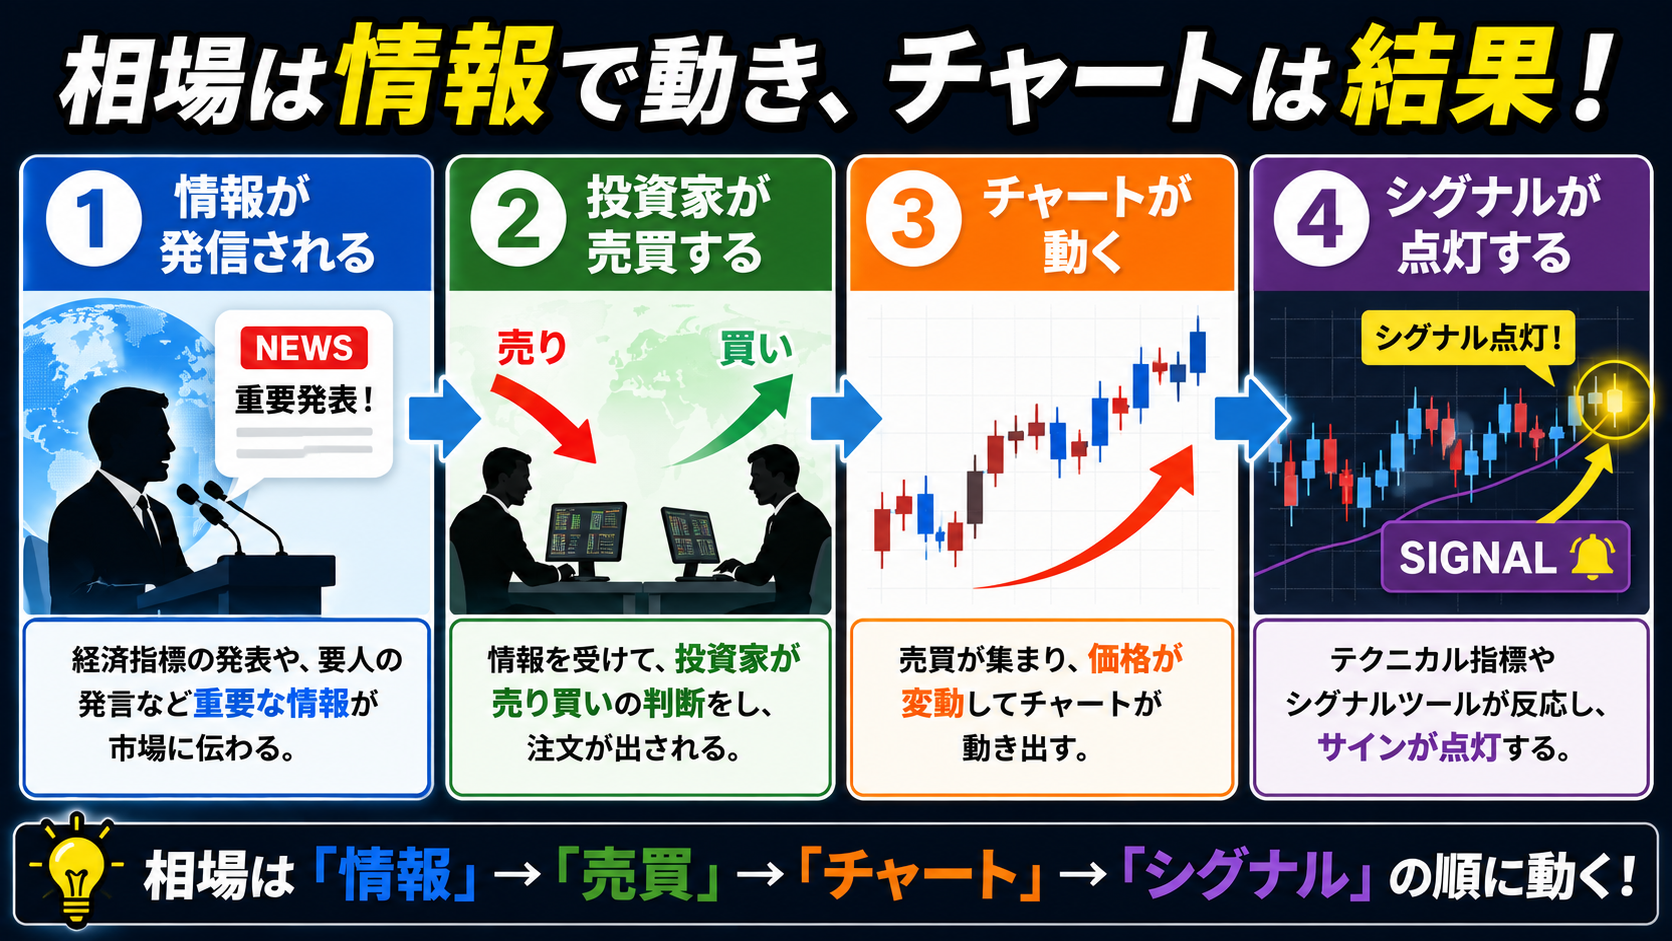
The market firstreacts to information, and as a result the charts move. After that, signal tools and technical indicators react.
In other words,
information is disseminated → investors buy/sell → charts move → signals light up
in that order.
What if you could know important information 10 minutes before it is publicly released?This would create a possibility to make buy/sell decisions earlier. That’s why in the market the “value of information” is given such great importance.
For those who have read previous posts, you may recall the news that I introduced last time, “President Trump pre-releases information on his own SNS.”
Signal tools tell you when to buy or sell. However, they do not tell you what is happening behind the scenes.
What you can see on the chart is the result of the market reacting to information. Whether that is a temporary rebound or a major trend reversal is sometimes difficult to determine from the chart alone.
In modern investing, just looking at charts is not enough.Information is released, investors buy/sell, and as a result the charts move. Understanding this flow is probably the first step to reading large market trends.
Practice and validate freely with a completely no-risk trade simulator!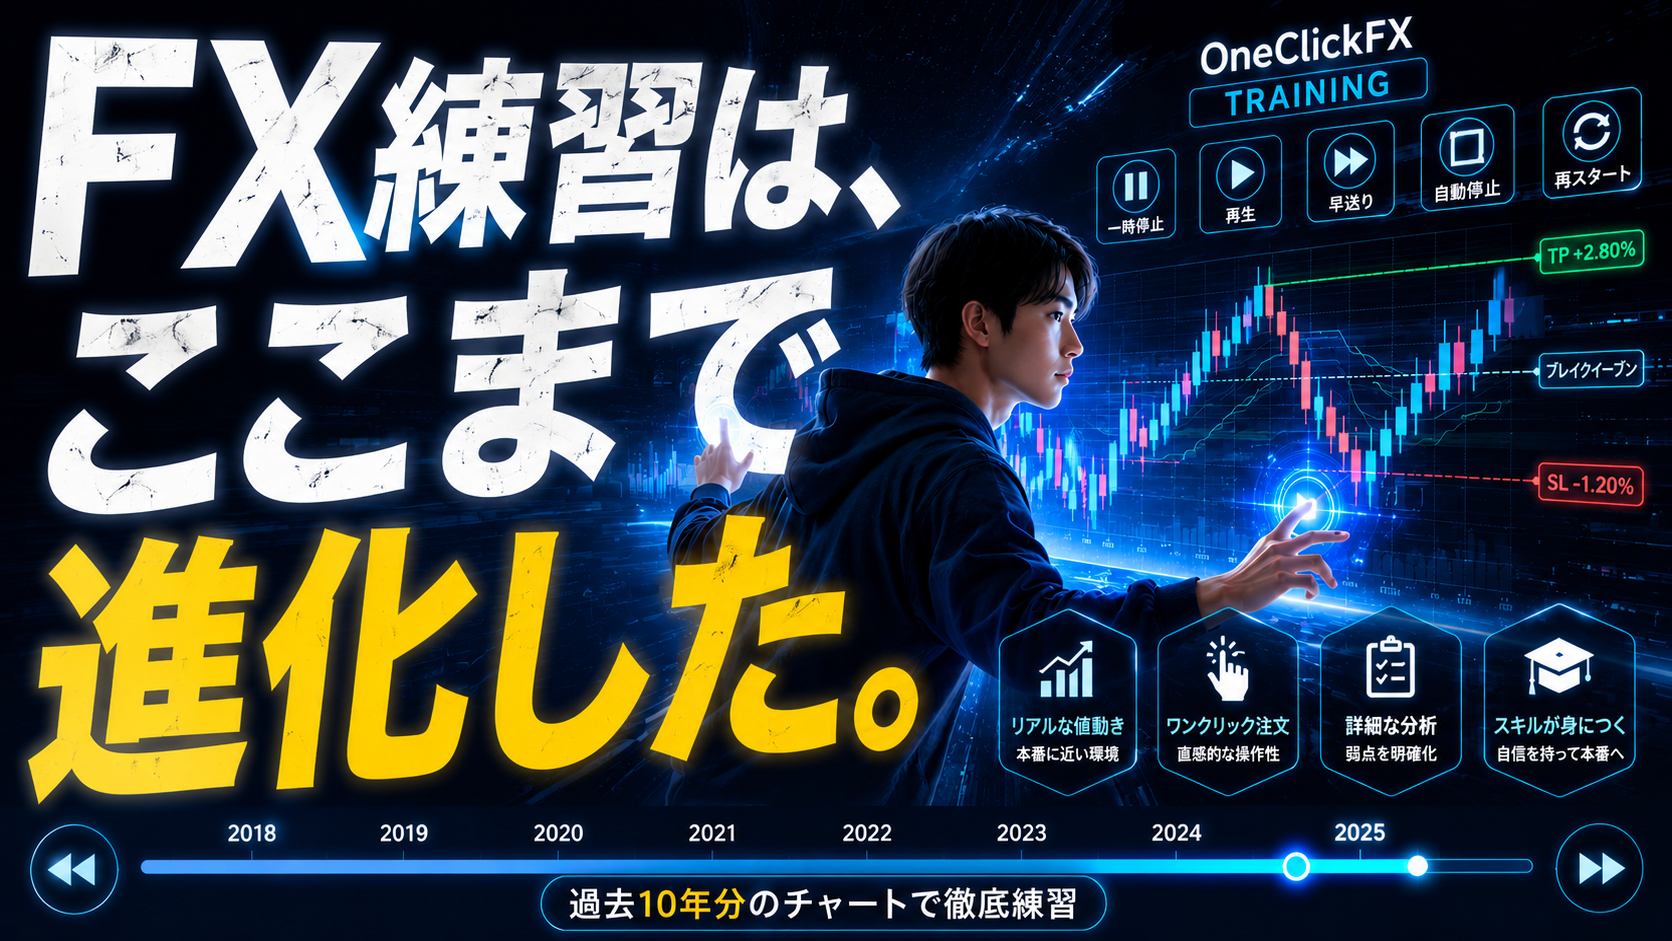
Details of the One-Click FX Training