
[Master RCI and Win with a Moving Average Filter!!] Super Trend and mBDSR Signals EURAUD 4-Hour Chart
【Mastering RCI!! Trend Reversal, Buy on Dips, Sell on Rallies】
Indicator that shines in combination with RCI: 【BODSOR・mBDSR】
and methods, case studies (PDF) ★GogoJungle AWARD2020 winner★
https://www.gogojungle.co.jp/tools/indicators/11836
※This product【BODSOR・mBDSR】includes over 550 PDFs (over 2,000 pages in total, over 1,950 chart images, over 700,000 characters) as methods and case studies.
About the PDFs included in the above product
About the 358 attached PDF files of 【BODSOR・mBDSR】
https://www.gogojungle.co.jp/finance/navi/articles/34271
【Mastering RCI!!】Summary of PDFs describing mBDSR (Moving Average Filter)
https://www.gogojungle.co.jp/finance/navi/articles/90127
【Mastering RCI!!】追加の PDFs for trading using 5-minute signals (Day Trading)
https://www.gogojungle.co.jp/finance/navi/articles/89870
【Mastering RCI!!】PDF collection for short-term 1-minute trades (Scalping)
https://www.gogojungle.co.jp/finance/navi/articles/88762
【Mastering RCI!!】PDF collection for 15-minute trades
https://www.gogojungle.co.jp/finance/navi/articles/113513
【Mastering RCI!!】PDF collection for 1-hour trades
https://www.gogojungle.co.jp/finance/navi/articles/116353
【Mastering RCI!!】Summary of PDFs explaining profit-taking points
https://www.gogojungle.co.jp/finance/navi/articles/89471
PDF collection to effectively utilize R1R2S2【Mastering RCI!!】
https://www.gogojungle.co.jp/finance/navi/articles/93154
【Mastering RCI!!】PDF collection for MT5 version of mBDSR
https://www.gogojungle.co.jp/finance/navi/articles/84918
mBDSR (RCI Filter)andmBDSR (Moving Average Filter)fulfill different roles. The usage distinctions are also described in the accompanying PDFs.
Below, we introduce example signals ofmBDSR (Moving Average Filter)signals.
Euro-Ozzy EuroAUD 4-hour chart
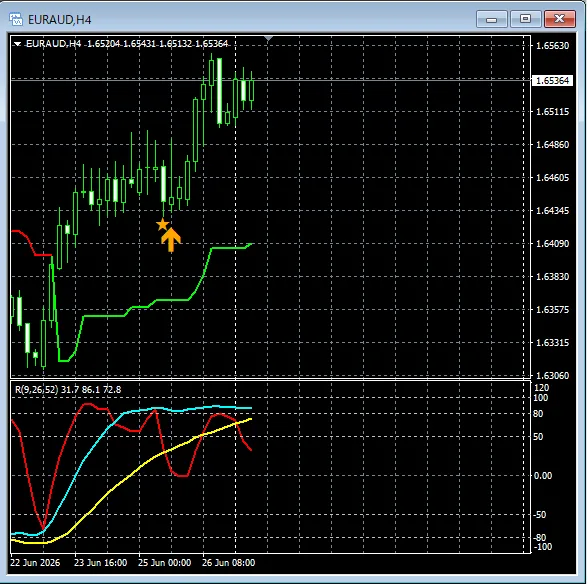
Super Trendis moving within the support line,signals of mBDSR (Moving Average Filter)light up and it declines.
In the case of the Moving Average Filter mBDSRas well,using it in conjunction with the higher-timeframe to lower-timeframe breakdown using the 3-line RCIallows for higher-probability trades. This is also explained in the attached PDFs.
※ Note: The charts shown in this article may have circles, lines, or rectangles added for explanation purposes.
Indiator that shines in combination with RCI【BODSOR・mBDSR】
and methods, case studies (PDF) ★GogoJungle AWARD2020 winner★
https://www.gogojungle.co.jp/tools/indicators/11836
Includes over 550 PDF files (methods and case studies: over 2,000 pages, over 700,000 characters).
Most of them are examples that logically link higher and lower timeframes using the 3-line RCI, and then progressively analyze the status of multiple lower timeframes, ultimately waiting for a dip-buy or pullback (i.e., mBDSR signals) on the lower timeframes.Also,
many of them emphasize identifying points where multiple entry reasons coincide.There are also examples of exploring upward and downward targets using the 3-line RCI method.
In the PDFs,
over 1,950 charts are used.

Blacksun's Indicators (List)
https://www.gogojungle.co.jp/finance/navi/articles/33779
Blacksun's free indicators and free e-books
https://www.gogojungle.co.jp/finance/navi/articles/90181
【Reference Videos (RCI and mBDSR related)】
Environment recognition using RCI and multi-timeframe analysis to wait for signals (1)
https://www.youtube.com/watch?v=1prvET_M5mA
Environment recognition using RCI and multi-timeframe analysis to wait for signals (2)
https://www.youtube.com/watch?v=vR4oD-oMVQQ
Environment recognition using RCI and multi-timeframe analysis to wait for signals (3)
https://www.youtube.com/watch?v=C6DHn0lD-I4
Environment recognition using RCI and multi-timeframe analysis to wait for signals (4)
https://www.youtube.com/watch?v=QG1iNTnLyyQ
Environment recognition using RCI and multi-timeframe analysis to wait for signals (5)
https://www.youtube.com/watch?v=VYlGiy6Cllg