
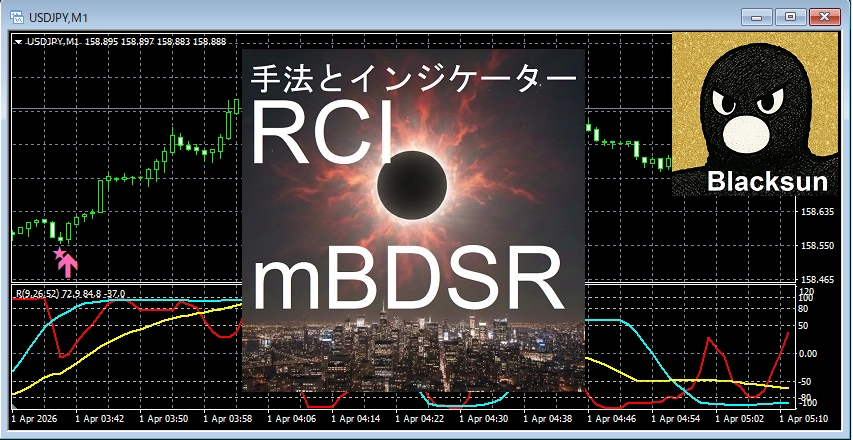
[Master RCI and conquer with moving average filter!!] Signals of Super Trend and mBDSR Crude Oil WTI 4-hour chart
【Mastering RCI!! Trend Reversals, Buy-the-Dip, and Sell-the-Rally】
Indicator that shines when combined with RCI【BODSOR・mBDSR】
and its methods and case studies (PDF) ★GogoJungle AWARD2020 Winner★
https://www.gogojungle.co.jp/tools/indicators/11836
※This product【BODSOR・mBDSR】includes more than 550 PDFs as methods and case studies (over 2,000 pages, over 1,950 chart images, and over 700,000 words in total).
About the PDFs included with the above product
358 PDF files included with【BODSOR・mBDSR】
https://www.gogojungle.co.jp/finance/navi/articles/34271
【Mastering RCI!!】Summary of PDFs explaining mBDSR (Moving Average Filter)
https://www.gogojungle.co.jp/finance/navi/articles/90127
【Mastering RCI!! Add PDFs】Collection of PDFs for trading using 5-minute chart signals (day trading)
https://www.gogojungle.co.jp/finance/navi/articles/89870
【Mastering RCI!!】Collection of PDFs for 1-minute short-term trading (scalping)
https://www.gogojungle.co.jp/finance/navi/articles/88762
【Mastering RCI!!】Collection of PDFs for 15-minute trading
https://www.gogojungle.co.jp/finance/navi/articles/113513
【Mastering RCI!!】Collection of PDFs for 1-hour trading
https://www.gogojungle.co.jp/finance/navi/articles/116353
【Mastering RCI!!】Summary of PDFs explaining profit-taking points
https://www.gogojungle.co.jp/finance/navi/articles/89471
PDF collection for effectively using R1R2S2【Mastering RCI!!】
https://www.gogojungle.co.jp/finance/navi/articles/93154
【Mastering RCI!!】PDF collection for effectively using MT5 version of mBDSR
https://www.gogojungle.co.jp/finance/navi/articles/84918
mBDSR (RCI filter)andmBDSR (Moving Average Filter)have different roles. The accompanying PDFs also discuss how to use them distinctly.
Below,examples of signals formBDSR (Moving Average Filter)
Crude Oil WTI 4-hour chart
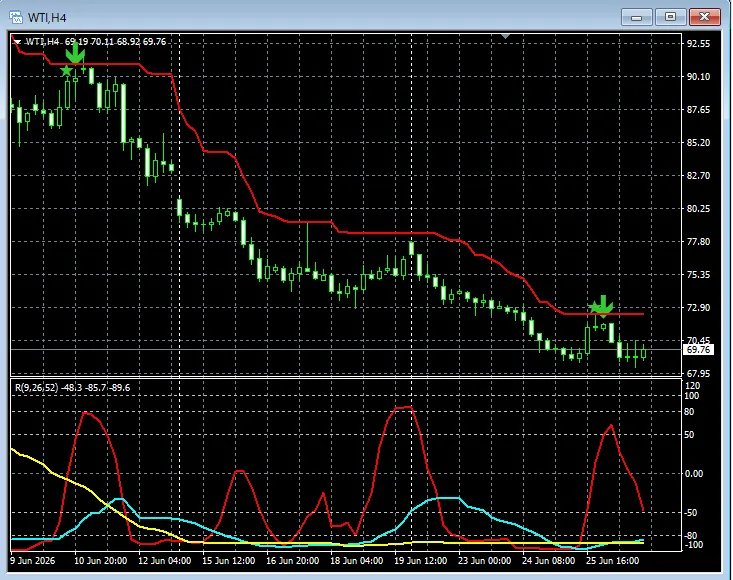
Super Trendis moving within a downtrend with its resistance line below,the signal from mBDSR (Moving Average Filter)is lighting up and continuing to drop.
In the case of the Moving Average Filter mBDSRas well,when used in conjunction with a top-down approach using the three RCI lines from higher to lower timeframes, it allows for high-probability trades. This is also explained inthe attached PDF.※Please note that in the charts mentioned in this article, for convenience of explanation we may have added circles, straight lines, or rectangles.Indicator that shines when combined with RCI【BODSOR・mBDSR】and its methods and case studies (PDF) ★GogoJungle AWARD2020 Winner★https://www.gogojungle.co.jp/tools/indicators/11836Includes more than 550 PDF files (methods and case studies: over 2,000 pages, over 700,000 words).Most of them are about logically linking higher and lower timeframes using three RCI lines to sequentially assess multiple lower-timeframe conditions, ultimately waiting for the entry timing on the lower timeframe (buy-the-dip or sell-the-rally as indicated by mBDSR). This is summarized in the PDFs.Also,many PDFs focus on identifying points where multiple entry reasons align..In addition,there are methods that explore upside and downside targets using three RCI lines..In the PDF explanations,more than 1,950 charts are used..Blacksun Indicators (List)https://www.gogojungle.co.jp/finance/navi/articles/33779About Blacksun’s free indicators and free eBookshttps://www.gogojungle.co.jp/finance/navi/articles/90181【Reference videos (RCI and mBDSR related)】Bring signals through environment recognition and multi-timeframe analysis using RCI (Part 1)https://www.youtube.com/watch?v=1prvET_M5mABring signals through environment recognition and multi-timeframe analysis using RCI (Part 2)https://www.youtube.com/watch?v=vR4oD-oMVQQBring signals through environment recognition and multi-timeframe analysis using RCI (Part 3)https://www.youtube.com/watch?v=C6DHn0lD-I4Bring signals through environment recognition and multi-timeframe analysis using RCI (Part 4)https://www.youtube.com/watch?v=QG1iNTnLyyQBring signals through environment recognition and multi-timeframe analysis using RCI (Part 5)https://www.youtube.com/watch?v=VYlGiy6Cllgthe attached PDF.
※Please note that in the charts mentioned in this article, for convenience of explanation we may have added circles, straight lines, or rectangles.
Indicator that shines when combined with RCI【BODSOR・mBDSR】
and its methods and case studies (PDF) ★GogoJungle AWARD2020 Winner★
https://www.gogojungle.co.jp/tools/indicators/11836
Includes more than 550 PDF files (methods and case studies: over 2,000 pages, over 700,000 words).
Most of them are about logically linking higher and lower timeframes using three RCI lines to sequentially assess multiple lower-timeframe conditions, ultimately waiting for the entry timing on the lower timeframe (buy-the-dip or sell-the-rally as indicated by mBDSR). This is summarized in the PDFs.
Also,many PDFs focus on identifying points where multiple entry reasons align..
In addition,there are methods that explore upside and downside targets using three RCI lines..
In the PDF explanations,more than 1,950 charts are used..

Blacksun Indicators (List)
https://www.gogojungle.co.jp/finance/navi/articles/33779
About Blacksun’s free indicators and free eBooks
https://www.gogojungle.co.jp/finance/navi/articles/90181
【Reference videos (RCI and mBDSR related)】
Bring signals through environment recognition and multi-timeframe analysis using RCI (Part 1)
https://www.youtube.com/watch?v=1prvET_M5mA
Bring signals through environment recognition and multi-timeframe analysis using RCI (Part 2)
https://www.youtube.com/watch?v=vR4oD-oMVQQ
Bring signals through environment recognition and multi-timeframe analysis using RCI (Part 3)
https://www.youtube.com/watch?v=C6DHn0lD-I4
Bring signals through environment recognition and multi-timeframe analysis using RCI (Part 4)
https://www.youtube.com/watch?v=QG1iNTnLyyQ
Bring signals through environment recognition and multi-timeframe analysis using RCI (Part 5)
https://www.youtube.com/watch?v=VYlGiy6Cllg