

「勝率98%・PF345」が出た日 ― その数字に飛びついてはいけない理由
I changed just one numeric setting of my Gold AI signal “Kinmyaku AI.” Then the performance panel showed,PF (Profit Factor) 345.54 / Win rate 98% (54 trades) / Latest +7,064 pipsnumbers I’ve never seen before. On social media, it would instantly spread as a “神インジ (God Indicator) discovery.” But as the developer, I cannot simply celebrate this as-is. Today, I’ll honestly explain why.
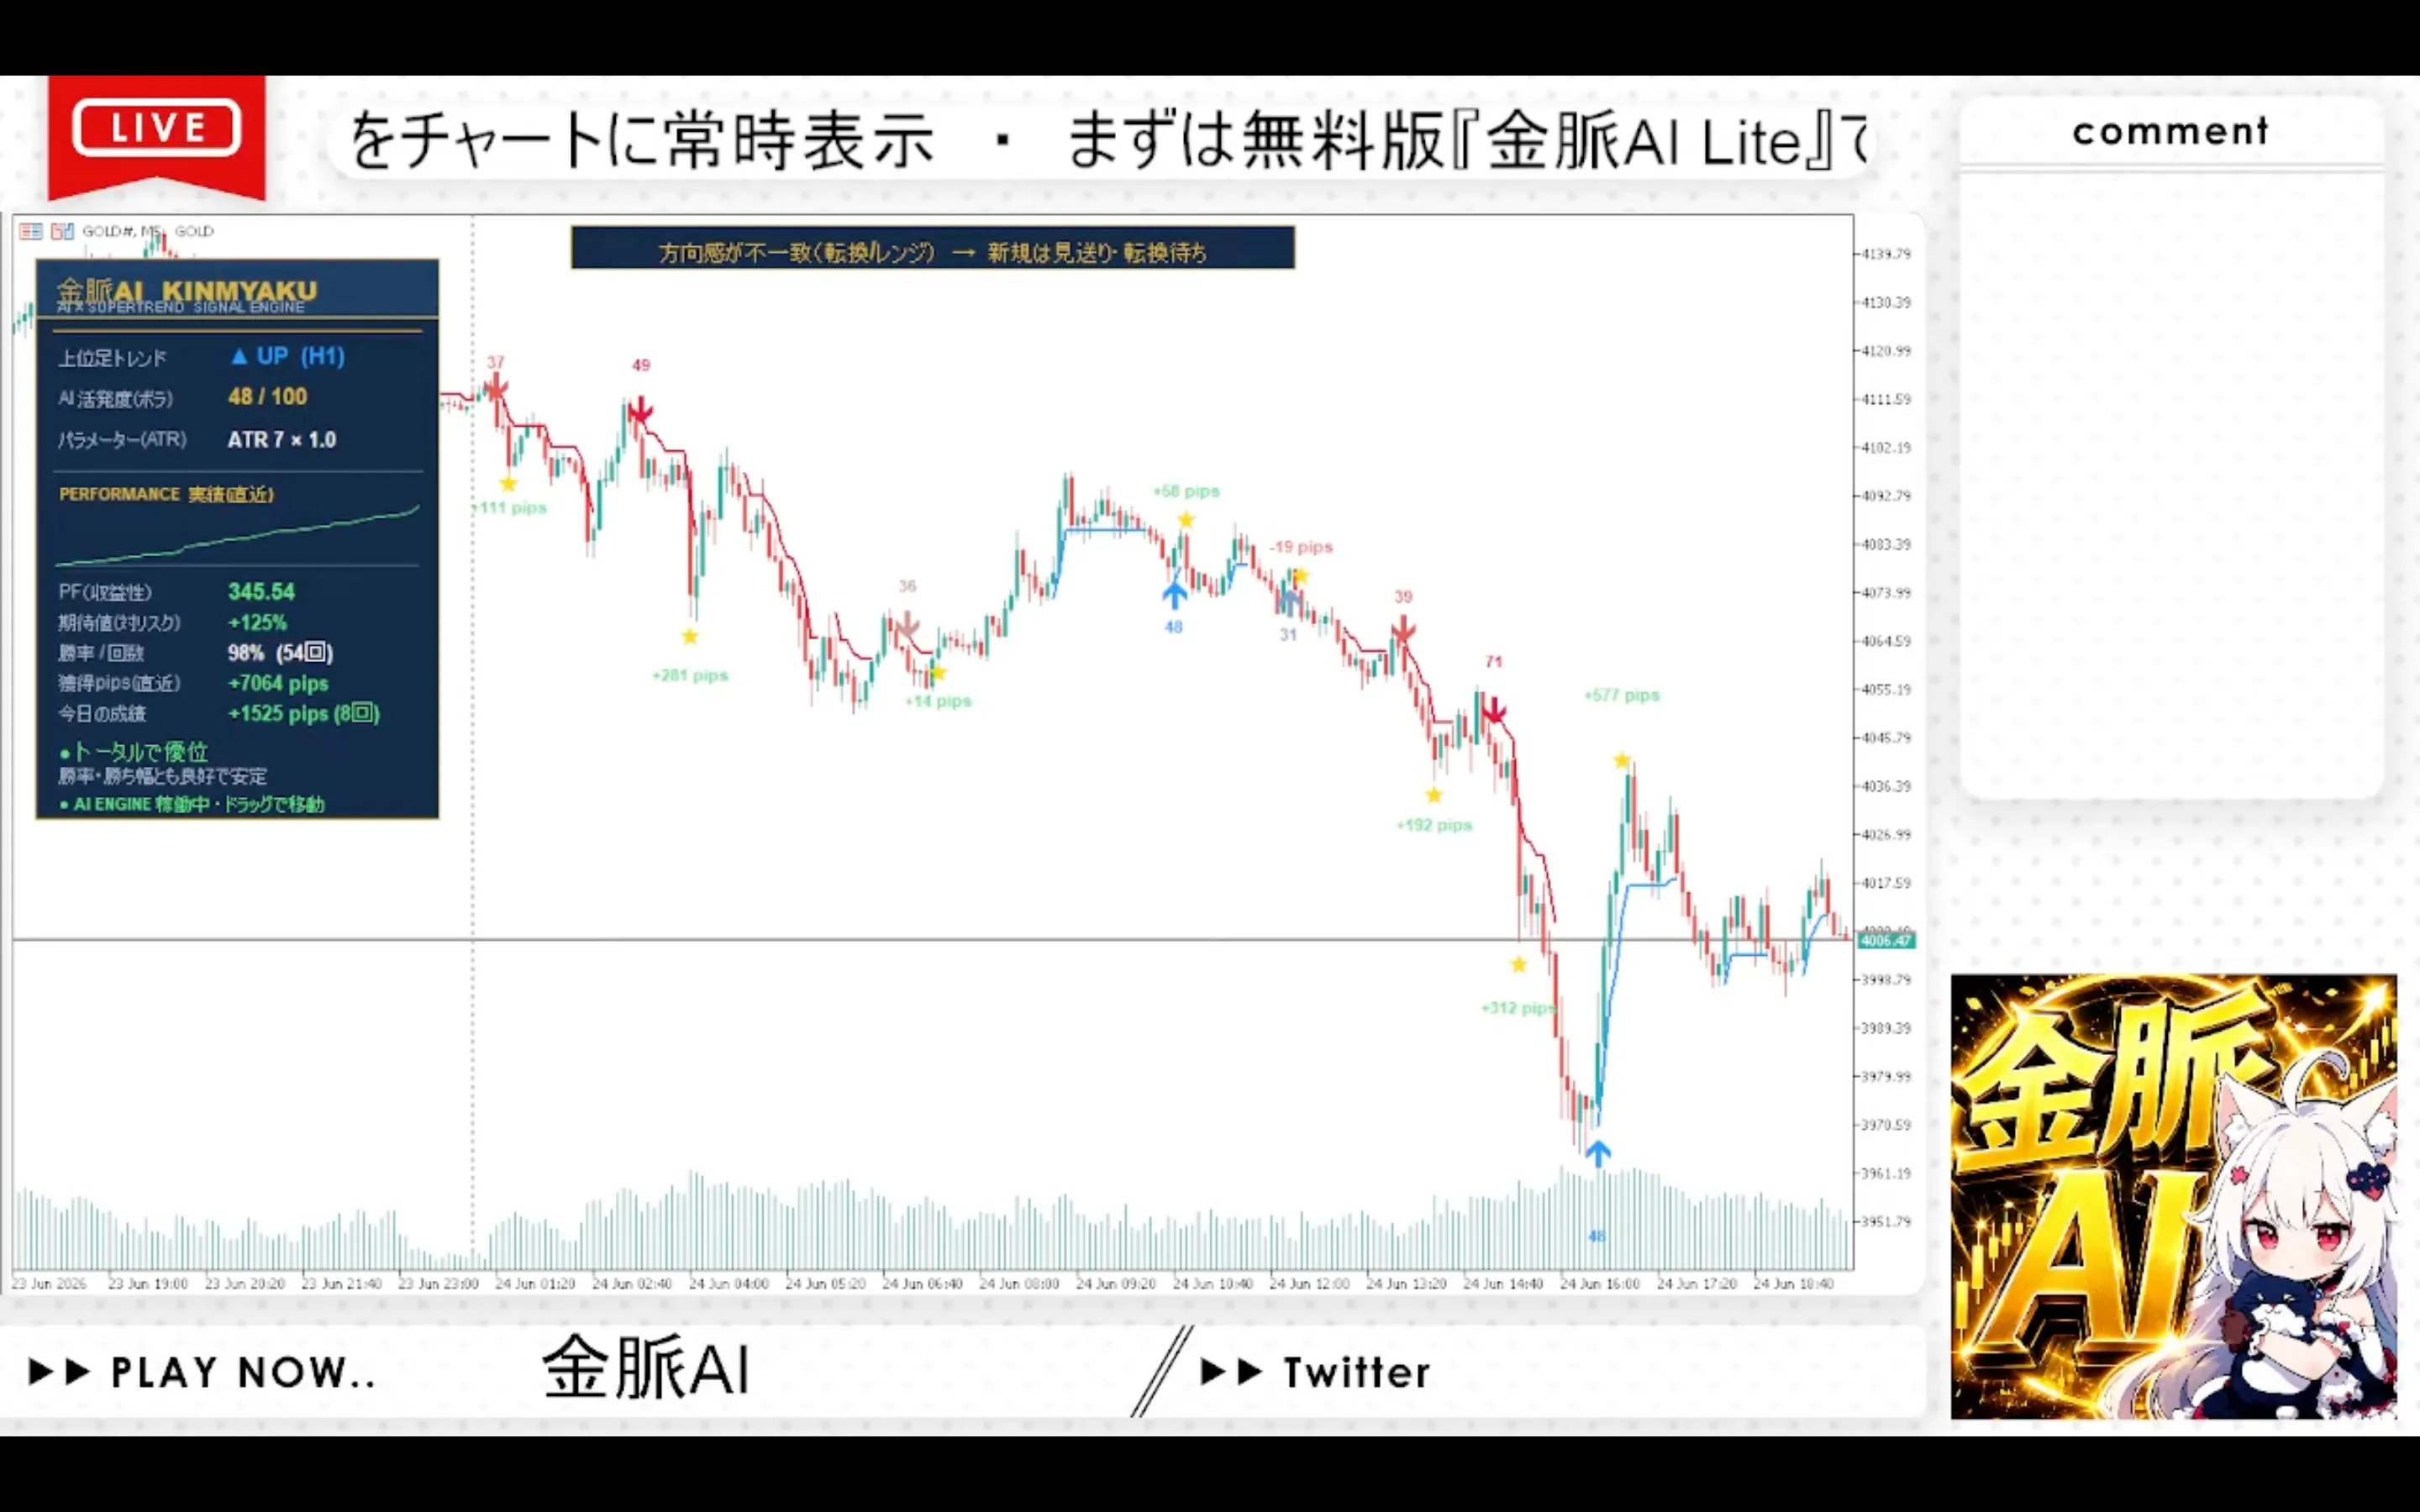
Kinmyaku AI uses SuperTrend (trail line drawn to price with ATR) to determine the trend. The change this time isnarrowing the ATR multiple from 2.5 to 1.0Just that.
When the multiplier is small, the trail line hugs the price tightly. As a result,profits are locked in as soon as a little profit appears, then move on quickly—this is what created those numbers.
If the trail is extremely narrow, this happens. Even small unrealized profits are taken quickly, soper-trade win rate increases dramatically, while losses stay small. The win rate soars, losses are kept small, so PF (total profit / total loss) appears disproportionately large.
One important fact. Win rate and PF can be “manufactured” by how you set the exit rules.“If you lock in profits bit by bit, the win rate goes up.” “If you push losing trades further, the win rate goes up.” This is separate from trading edge; it’s a matter of presentation.
※A high win rate or PF does not equal strength. It’s about where you take profits.
① Pips are not money.Even if you see +7,064 pips, gold carries a spread (cost). The more often you take small profits, the larger the cost proportion, and your actual take-home will be much smaller than the appearance.
② Narrow trails are weak to reversals.A line that hugs the price closely can be cut by a slight retrace. It looks good on clear-trend days, but during consolidation, false profit-taking and stop-outs increase.
③ This is the figure from the most recent window.Panel performance covers only a recent period. If you slice out the time when trends were pronounced, any method can look good. There’s no guarantee the same numbers will appear in the long term or in other markets.
④ The scare of 98% win rate.In reverse, this tends to encourage taking big risks on occasional losses. Even with 98% wins, if the remaining 2% wipes out gains, it’s meaningless. A high win rate is not proof of safety.
So what should you look at?Total expected value after costs, drawdown (maximum drop), whether it remains solid over long terms or other periods, and how large the worst loss could be. It’s modest, but that’s where true edge shows.
Keeping Kinmyaku AI’s standard setting (ATR × 2.5) from becoming flashy is intentional. Rather than the appearance of a high win rate, I choose a design thatextends the trend and increases total gains. The approach is not to guess direction, but to grade only when there is movement — and today’s “win rate 98% at ×1.0” is a completely opposite direction of that philosophy.
What I want to convey most today is this.When you see a dashboard that looks incredibly good with “Win rate ○○%” and “PF ○○,” be skeptical first.Because you can easily create such numbers with your own tools. I demonstrated this with my own tool to encourage a calm, discerning eye for the numerous “God Indicators” out there. Look at how the numbers werecreated. That is the best defense for lasting survival.
- If you narrow the ATR multiple from 2.5 to 1.0, you get a “wow” panel with Win rate 98%・PF345・+7,064 pips
- The real story is simply profits locked in bit by bit.Win rate and PF can be manufactured by the exiting cadence—a superficial number
- Pitfalls = pips are not money / vulnerable to reversals / latest-window figures / the risk behind 98% win rate
- What to look atCost-adjusted expected value・Drawdown・Long-term/other periods・Worst loss
- Be skeptical of flashy dashboards. Develop the eye to see how numbers were made
※This column is for information purposes and is not investment solicitation. The displayed figures are reference values based on specific settings and periods and do not guarantee future profits. Changes to settings are at your own risk; please verify with a free version or a demo first. Please make your own final decision.

※This article provides information and is not investment solicitation. The performance results shown are past results and do not guarantee future profits. FX/CFD trading involves risk. Please make investment decisions at your own risk.