
[Master RCI to Victory!!] Nikkei Average JP225 1-Minute Chart Double Top and mBDSR Signal
【Mastering RCI!! Trend Reversal, Buy on Dip, Sell on Rallies】
Indicator that shines when combined with RCI【BODSOR・mBDSR】
and techniques, case studies (PDF) ★GogoJungle AWARD2020 Winner★
https://www.gogojungle.co.jp/tools/indicators/11836
This product【BODSOR・mBDSR】includes over 550 PDFs (over 2,000 pages in total, more than 1,950 chart images, over 700,000 words) as methods and case studies.
About the PDFs included in the above product
Regarding the 358 PDFs included with 【BODSOR・mBDSR】
https://www.gogojungle.co.jp/finance/navi/articles/34271
【Mastering RCI!!】 Summary of PDFs explaining mBDSR (Moving Average Filter)
https://www.gogojungle.co.jp/finance/navi/articles/90127
【Mastering RCI!!】 PDF Collection for Trading with 5-minute Signals (Day Trading)
https://www.gogojungle.co.jp/finance/navi/articles/89870
【Mastering RCI!!】 PDF Collection for 1-minute Short-term Trading (Scalping)
https://www.gogojungle.co.jp/finance/navi/articles/88762
【Mastering RCI!!】 PDF Collection for 15-minute Trading
https://www.gogojungle.co.jp/finance/navi/articles/113513
【Mastering RCI!!】 Summary of PDFs Explaining Profit-taking Points
https://www.gogojungle.co.jp/finance/navi/articles/89471
PDF collection for effectively utilizing R1R2S2【Mastering RCI!!】
https://www.gogojungle.co.jp/finance/navi/articles/93154
【Mastering RCI!!】 PDF collection to effectively utilize MT5 version of mBDSR
https://www.gogojungle.co.jp/finance/navi/articles/84918
Below, we introducesign examples of mBDSR (RCI two-filter).
Nikkei Average JP225 1-minute chart
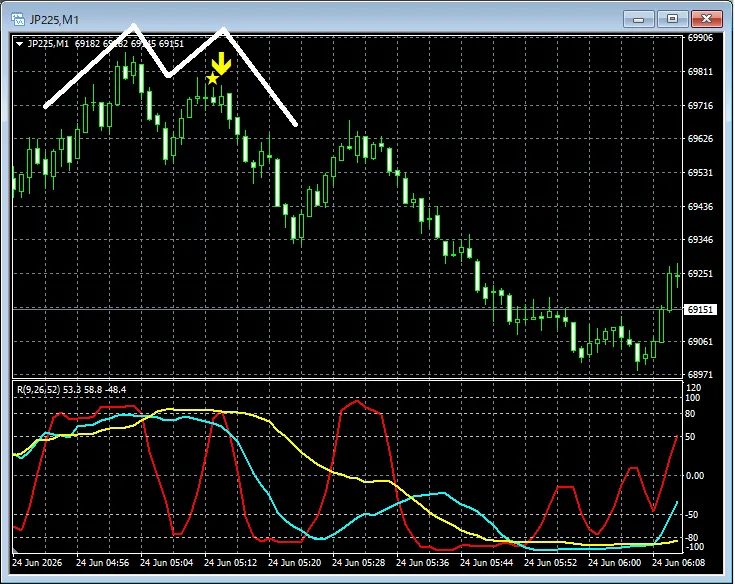
In the above chart,double top, the timing of the start of the decline on the right peakis well captured by the sign of mBDSR (RCI two-filter).
With moving average filter mBDSRas well, combining with the concept of dropping from higher to lower timeframe using the three RCI linesenables high-probability trades. This is also explained in the attached PDFs.
※ Please note that in the charts introduced in this article, for convenience of explanation, circles, straight lines, and rectangles may be drawn.
Indiator that shines when combined with RCI【BODSOR・mBDSR】
and techniques, case studies (PDF) ★GogoJungle AWARD2020 Winner★
https://www.gogojungle.co.jp/tools/indicators/11836
Comes with more than 550 PDF files (methods and case studies: over 2,000 pages, over 690,000 characters) in total.
Most of these are structured as a logical linking of higher and lower timeframes using the three RCI lines, progressing through examining the conditions of multiple lower timeframes and ultimately waiting for buy the dip or sell the rally signals on the lower timeframes (i.e., the mBDSR signs).
Additionally,many emphasize capturing points where multiple entry reasons align..
Also included is a method for exploring ascent and decline targets using the three RCI lines.
In the PDF explanations,over 1,950 chartsare used.

Blacksun Indicators (List)
https://www.gogojungle.co.jp/finance/navi/articles/33779
About Blacksun's free indicators and free e-books
https://www.gogojungle.co.jp/finance/navi/articles/90181
【Reference videos (RCI and mBDSR related)】
Signal waiting using environment recognition and multi-time-frame analysis with RCI (1)
https://www.youtube.com/watch?v=1prvET_M5mA
Signal waiting using environment recognition and multi-time-frame analysis with RCI (2)
https://www.youtube.com/watch?v=vR4oD-oMVQQ
Signal waiting using environment recognition and multi-time-frame analysis with RCI (3)
https://www.youtube.com/watch?v=C6DHn0lD-I4
Signal waiting using environment recognition and multi-time-frame analysis with RCI (4)
https://www.youtube.com/watch?v=QG1iNTnLyyQ
Signal waiting using environment recognition and multi-time-frame analysis with RCI (5)
https://www.youtube.com/watch?v=VYlGiy6Cllg