
[Master RCI and Win with a Moving Average Filter!!] EUR/AUD 5-minute chart Super Trend and mBDSR signals
【Mastering RCI!! Trend Reversal, Buy the Dip, Sell the Rally】
Indicator that shines when combined with RCI: 【BODSOR・mBDSR】
and its method, case studies (PDF) ★GogoJungle AWARD2020 Recipient★
https://www.gogojungle.co.jp/tools/indicators/11836
※This product【BODSOR・mBDSR】includes more than 550 PDFs as methods and case studies (over 2,000 pages, over 1,950 chart images, over 700,000 words in total).
About the PDFs Included in the Above Product
About the 358 PDF files included with 【BODSOR・mBDSR】
https://www.gogojungle.co.jp/finance/navi/articles/34271
【Mastering RCI!!】Summary of PDFs describing mBDSR (Moving Average Filter)
https://www.gogojungle.co.jp/finance/navi/articles/90127
【Mastering RCI!!】PDF Additions: Trade using 5-minute signals (Day Trading) – PDF collection
https://www.gogojungle.co.jp/finance/navi/articles/89870
【Mastering RCI!!】PDF collection for short-term 1-minute trades (Scalping)
https://www.gogojungle.co.jp/finance/navi/articles/88762
【Mastering RCI!!】PDF collection for 15-minute trades
https://www.gogojungle.co.jp/finance/navi/articles/113513
【Mastering RCI!!】PDF collection for 1-hour trades
https://www.gogojungle.co.jp/finance/navi/articles/116353
【Mastering RCI!!】PDF summary explaining profit-taking points
https://www.gogojungle.co.jp/finance/navi/articles/89471
PDF collection to effectively utilize R1R2S2【Mastering RCI!!】
https://www.gogojungle.co.jp/finance/navi/articles/93154
【Mastering RCI!!】PDF collection to effectively use MT5 version of mBDSR
https://www.gogojungle.co.jp/finance/navi/articles/84918
mBDSR (RCI Filter)andmBDSR (Moving Average Filter)have different roles. The corresponding usage is also touched upon in the included PDFs.
Below, we introduce examples of signals for themBDSR (Moving Average Filter)signals.
Euro/Australia pair EURAUD 5-minute chart
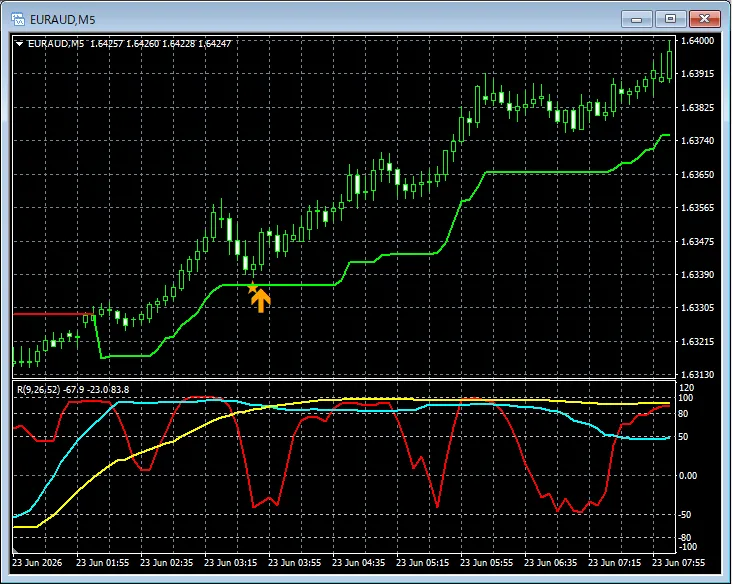
Break above the Super Trend resistance line and pullbackandthe mBDSR signal lights up and rises further.With the Moving Average Filter mBDSRas wellCombining with the RCI three-line top-down from higher to lower timeframes yields high-precision tradesThis is also explained in the included PDF.※ Some charts mentioned in this article may have added circles, lines, or rectangles for explanatory convenience—please note.Indicator that shines when combined with RCI【BODSOR・mBDSR】and its method, case studies (PDF) ★GogoJungle AWARD2020 Recipient★https://www.gogojungle.co.jp/tools/indicators/11836Includes more than 550 PDF files (methods and case studies: over 2,000 pages, over 700,000 words).Many of them are compiled as examples that logically link higher and lower timeframes using the three RCI lines, ultimately detailing a step-by-step approach to waiting for dips or pullbacks in the lower timeframes (i.e., mBDSR signals).Additionally,many aim to capture points where multiple entry reasons coincide.There are also methods that explore upside and downside targets using RCI three-line tops.In the PDFs,over 1,950 charts are used..Blacksun Indicators (List)https://www.gogojungle.co.jp/finance/navi/articles/33779Blacksun Free Indicators and Free E-bookshttps://www.gogojungle.co.jp/finance/navi/articles/90181【Reference Videos (RCI and mBDSR related)】Environment recognition with RCI and multi-timeframe analysis leading to waiting for signs (1)https://www.youtube.com/watch?v=1prvET_M5mAEnvironment recognition with RCI and multi-timeframe analysis leading to waiting for signs (2)https://www.youtube.com/watch?v=vR4oD-oMVQQEnvironment recognition with RCI and multi-timeframe analysis leading to waiting for signs (3)https://www.youtube.com/watch?v=C6DHn0lD-I4Environment recognition with RCI and multi-timeframe analysis leading to waiting for signs (4)https://www.youtube.com/watch?v=QG1iNTnLyyQEnvironment recognition with RCI and multi-timeframe analysis leading to waiting for signs (5)https://www.youtube.com/watch?v=VYlGiy6Cllg
With the Moving Average Filter mBDSRas wellCombining with the RCI three-line top-down from higher to lower timeframes yields high-precision tradesThis is also explained in the included PDF.
※ Some charts mentioned in this article may have added circles, lines, or rectangles for explanatory convenience—please note.
Indicator that shines when combined with RCI【BODSOR・mBDSR】
and its method, case studies (PDF) ★GogoJungle AWARD2020 Recipient★
https://www.gogojungle.co.jp/tools/indicators/11836
Includes more than 550 PDF files (methods and case studies: over 2,000 pages, over 700,000 words).
Many of them are compiled as examples that logically link higher and lower timeframes using the three RCI lines, ultimately detailing a step-by-step approach to waiting for dips or pullbacks in the lower timeframes (i.e., mBDSR signals).Additionally,
many aim to capture points where multiple entry reasons coincide.There are also methods that explore upside and downside targets using RCI three-line tops.
In the PDFs,over 1,950 charts are used.
.

Blacksun Indicators (List)
https://www.gogojungle.co.jp/finance/navi/articles/33779
Blacksun Free Indicators and Free E-books
https://www.gogojungle.co.jp/finance/navi/articles/90181
【Reference Videos (RCI and mBDSR related)】
Environment recognition with RCI and multi-timeframe analysis leading to waiting for signs (1)
https://www.youtube.com/watch?v=1prvET_M5mA
Environment recognition with RCI and multi-timeframe analysis leading to waiting for signs (2)
https://www.youtube.com/watch?v=vR4oD-oMVQQ
Environment recognition with RCI and multi-timeframe analysis leading to waiting for signs (3)
https://www.youtube.com/watch?v=C6DHn0lD-I4
Environment recognition with RCI and multi-timeframe analysis leading to waiting for signs (4)
https://www.youtube.com/watch?v=QG1iNTnLyyQ
Environment recognition with RCI and multi-timeframe analysis leading to waiting for signs (5)
https://www.youtube.com/watch?v=VYlGiy6Cllg