
From higher time frame to lower time frame: Master RCI to win!! 4-hour chart, 15-minute chart, and mBDSR signals
【Mastering RCI!! Trend Reversal, Buy on Dips, Sell on Rallies】
Indicator that shines in combination with RCI【BODSOR・mBDSR】
and methods, case studies (PDF) ★GogoJungle AWARD2020 winner★
https://www.gogojungle.co.jp/tools/indicators/11836
※This product【BODSOR・mBDSR】includes more than 550 PDFs (over 2,000 pages, over 1,950 chart images, and over 700,000 characters) as methods and case studies.
About the PDFs included with the above product
About the 358 attached PDFs for 【BODSOR・mBDSR】
https://www.gogojungle.co.jp/finance/navi/articles/34271
【Mastering RCI to Win!!】Summary of PDFs explaining mBDSR (moving average filter)
https://www.gogojungle.co.jp/finance/navi/articles/90127
【Mastering RCI to Win!!】PDF追加: Collection of PDFs for day trading using 5-minute signals
https://www.gogojungle.co.jp/finance/navi/articles/89870
【Mastering RCI to Win!!】Collection of PDFs for 1-minute short-term trading (scalping)
https://www.gogojungle.co.jp/finance/navi/articles/88762
【Mastering RCI to Win!!】Collection of PDFs for 15-minute trading
https://www.gogojungle.co.jp/finance/navi/articles/113513
【Mastering RCI to Win!!】Collection of PDFs for 1-hour trading
https://www.gogojungle.co.jp/finance/navi/articles/116353
【Mastering RCI to Win!!】Summary of PDFs explaining profit-taking points
https://www.gogojungle.co.jp/finance/navi/articles/89471
PDF collection for effectively utilizing R1R2S2【Mastering RCI to Win!!】
https://www.gogojungle.co.jp/finance/navi/articles/93154
【Mastering RCI to Win!!】PDF collection to effectively use MT5 version of mBDSR
https://www.gogojungle.co.jp/finance/navi/articles/84918
Below, we introduce examples of signals formBDSR (RCI two-filter)signals.
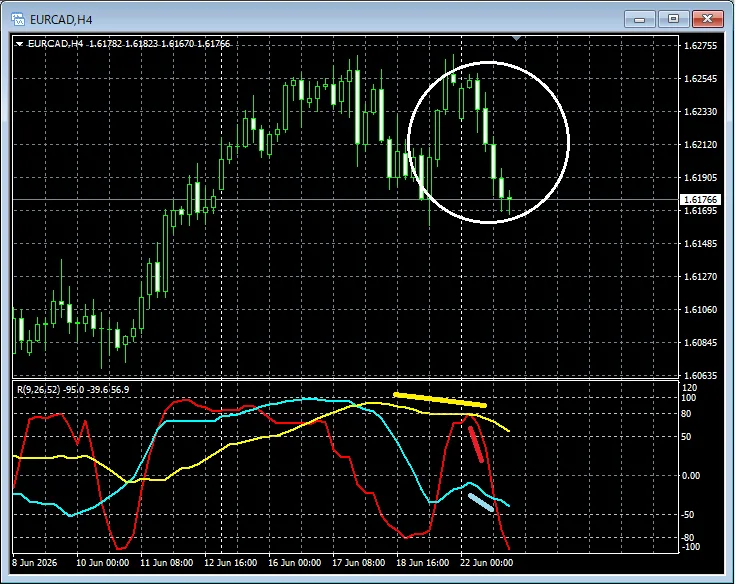
Euro Canadian Dollar EURCAD 4-hour chart
Euro Canadian Dollar EURCAD 15-minute chart
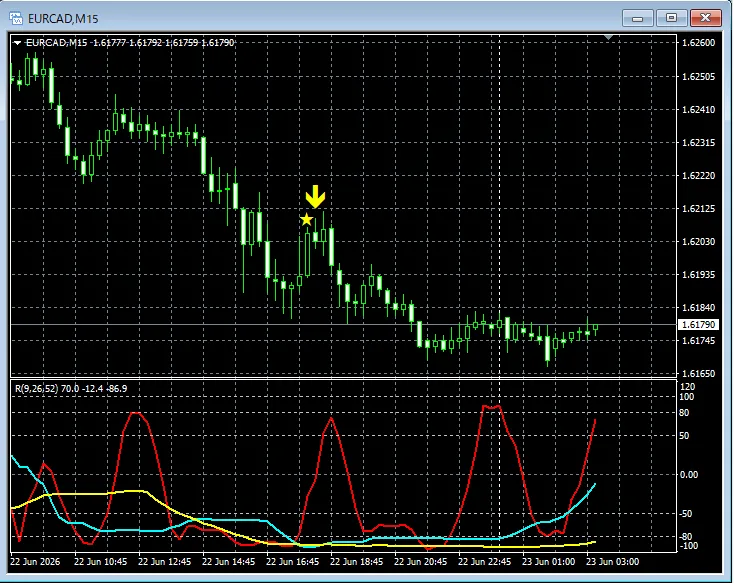
On the 4-hour chart,RCI 3-lineis showing a very weak trend, and on the 15-minute chart,the return-sell signal of mBDSR (RCI two-filter) lights up at the right timing and continues lower.※Note: In the charts shown in this article, for convenience of explanation, circles, lines, rectangles, etc., may be drawn.Indicator that shines in combination with RCI【BODSOR・mBDSR】and methods, case studies (PDF) ★GogoJungle AWARD2020 winner★https://www.gogojungle.co.jp/tools/indicators/11836More than 550 PDF files (methods and case studies: over 2,000 pages, over 700,000 characters) are included.Most of them areexamples that link multiple higher and lower timeframes logically using the RCI 3-line setup, then analyze the conditions of multiple lower-timeframe charts sequentially, and finally wait for dips buying or rallies selling timing (i.e., the signals of mBDSR) on the lower timeframe.Also,many of them focus on identifying points where multiple entry reasons overlap..Additionally,there are methods that explore potential upside and downside using the RCI 3-line setup..In the PDF explanations,over 1,950 charts are used..Blacksun Indicators (List)https://www.gogojungle.co.jp/finance/navi/articles/33779Blacksun free indicators and free eBookshttps://www.gogojungle.co.jp/finance/navi/articles/90181【Reference Videos (RCI and mBDSR related)】Environment recognition and multi-timeframe analysis using RCI to wait for signals (1)https://www.youtube.com/watch?v=1prvET_M5mAEnvironment recognition and multi-timeframe analysis using RCI to wait for signals (2)https://www.youtube.com/watch?v=vR4oD-oMVQQEnvironment recognition and multi-timeframe analysis using RCI to wait for signals (3)https://www.youtube.com/watch?v=C6DHn0lD-I4Environment recognition and multi-timeframe analysis using RCI to wait for signals (4)https://www.youtube.com/watch?v=QG1iNTnLyyQEnvironment recognition and multi-timeframe analysis using RCI to wait for signals (5)https://www.youtube.com/watch?v=VYlGiy6Cllg
※Note: In the charts shown in this article, for convenience of explanation, circles, lines, rectangles, etc., may be drawn.
Indicator that shines in combination with RCI【BODSOR・mBDSR】
and methods, case studies (PDF) ★GogoJungle AWARD2020 winner★
https://www.gogojungle.co.jp/tools/indicators/11836
More than 550 PDF files (methods and case studies: over 2,000 pages, over 700,000 characters) are included.
Most of them areexamples that link multiple higher and lower timeframes logically using the RCI 3-line setup, then analyze the conditions of multiple lower-timeframe charts sequentially, and finally wait for dips buying or rallies selling timing (i.e., the signals of mBDSR) on the lower timeframe.
Also,many of them focus on identifying points where multiple entry reasons overlap..
Additionally,there are methods that explore potential upside and downside using the RCI 3-line setup..
In the PDF explanations,over 1,950 charts are used..

Blacksun Indicators (List)
https://www.gogojungle.co.jp/finance/navi/articles/33779
Blacksun free indicators and free eBooks
https://www.gogojungle.co.jp/finance/navi/articles/90181
【Reference Videos (RCI and mBDSR related)】
Environment recognition and multi-timeframe analysis using RCI to wait for signals (1)
https://www.youtube.com/watch?v=1prvET_M5mA
Environment recognition and multi-timeframe analysis using RCI to wait for signals (2)
https://www.youtube.com/watch?v=vR4oD-oMVQQ
Environment recognition and multi-timeframe analysis using RCI to wait for signals (3)
https://www.youtube.com/watch?v=C6DHn0lD-I4
Environment recognition and multi-timeframe analysis using RCI to wait for signals (4)
https://www.youtube.com/watch?v=QG1iNTnLyyQ
Environment recognition and multi-timeframe analysis using RCI to wait for signals (5)
https://www.youtube.com/watch?v=VYlGiy6Cllg