
【Master RCI to Win Extremely!!】 Super Trend and mBDSR signals Gold XAUUSD 1-minute chart
【Mastering RCI!! Trend Reversal, Buy Dips, Sell Rallies】
Indicator【BODSOR・mBDSR】that shines when paired with RCI
and methods・case studies (PDF) ★GogoJungle AWARD2020 winner★
https://www.gogojungle.co.jp/tools/indicators/11836
※This product【BODSOR・mBDSR】includes over 550 PDFs (over 2,000 pages, more than 1,950 charts, over 700,000 words) as methods and case studies.
Regarding the PDFs included with the above product
358 PDFs accompanying【BODSOR・mBDSR】
https://www.gogojungle.co.jp/finance/navi/articles/34271
Summary of PDFs describing mBDSR (Moving Average Filter) in【Mastering RCI!!】
https://www.gogojungle.co.jp/finance/navi/articles/90127
【Mastering RCI!!】 PDF collection for trading using 5-minute signals (Day trading)
https://www.gogojungle.co.jp/finance/navi/articles/89870
【Mastering RCI!!】 PDF collection for short-term 1-minute trades (scalping)
https://www.gogojungle.co.jp/finance/navi/articles/88762
【Mastering RCI!!】 PDF collection for 15-minute trades
https://www.gogojungle.co.jp/finance/navi/articles/113513
【Mastering RCI!!】 Summary of PDFs describing profit-taking points
https://www.gogojungle.co.jp/finance/navi/articles/89471
PDF collection to effectively utilize R1R2S2【Mastering RCI!!】
https://www.gogojungle.co.jp/finance/navi/articles/93154
【Mastering RCI!!】 PDF collection to effectively use MT5 version of mBDSR
https://www.gogojungle.co.jp/finance/navi/articles/84918
Below, we introducesign examples of the mBDSR (RCI2-filter).
Gold XAUUSD 1-minute chart
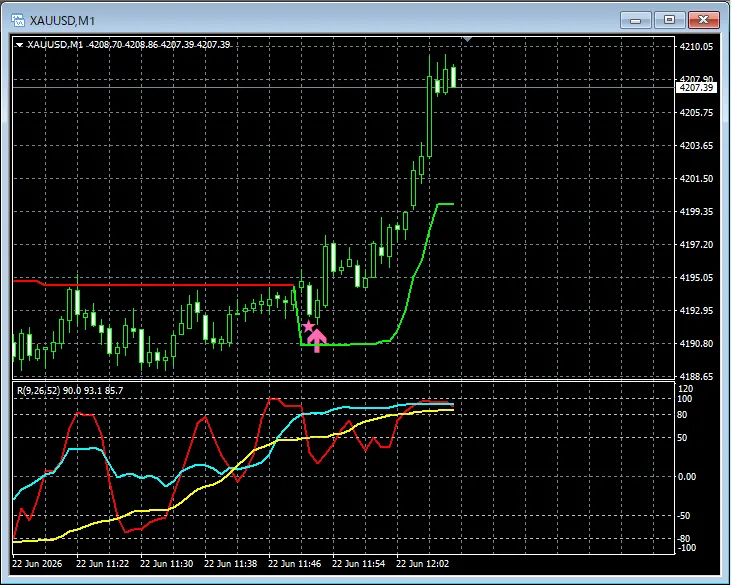
Super Trendafter breaking above the support linemBDSRbuy-the-dip signal lights up and it declines.
※Note: In the charts mentioned in this article, for convenience of explanation, please be aware that circles, straight lines, and squares may be added.
Indicator【BODSOR・mBDSR】that shines when paired with RCI
and methods・case studies (PDF) ★GogoJungle AWARD2020 winner★
https://www.gogojungle.co.jp/tools/indicators/11836
Over 550 PDF files (methods・case studies: over 2,000 pages, over 700,000 characters) are included.
Many of them are structured ascases where one logically links higher and lower timeframes using three RCI lines, systematically considering multiple lower-timeframe conditions, and ultimately waiting for dip-buy or pullback-sell timing (i.e., the mBDSR signals) on the lower timeframes.
Additionally,there is a focus on identifying points where multiple entry reasons overlapas well.
Note thatthe method also explores potential upside and downside targets using three RCI lines.
In the PDFs,over 1,950 chartsare used.

Blacksun Indicators (List)
https://www.gogojungle.co.jp/finance/navi/articles/33779
Free Blacksun indicators and free eBooks
https://www.gogojungle.co.jp/finance/navi/articles/90181
【Reference videos (RCI and mBDSR related)】
Environmental recognition and multi-timeframe analysis using RCI to wait for signals (1)
https://www.youtube.com/watch?v=1prvET_M5mA
Environmental recognition and multi-timeframe analysis using RCI to wait for signals (2)
https://www.youtube.com/watch?v=vR4oD-oMVQQ
Environmental recognition and multi-timeframe analysis using RCI to wait for signals (3)
https://www.youtube.com/watch?v=C6DHn0lD-I4
Environmental recognition and multi-timeframe analysis using RCI to wait for signals (4)
https://www.youtube.com/watch?v=QG1iNTnLyyQ
Environmental recognition and multi-timeframe analysis using RCI to wait for signals (5)
https://www.youtube.com/watch?v=VYlGiy6Cllg