
FOMC and USD/JPY 5-minute chart 【Master RCI to Win!!】 Super Trend and mBDSR signals
【Mastering RCI!! Trend Reversals, Buying on Dips, Selling on Rallies】
Indicator that shines in combination with RCI【BODSOR・mBDSR】
Methods, case studies (PDF) ★GogoJungle AWARD2020 winner★
https://www.gogojungle.co.jp/tools/indicators/11836
※This product【BODSOR・mBDSR】includes over 550 PDFs (over 2,000 pages, more than 1,950 chart pages, over 700,000 characters in total) as methods and case studies.
About the PDFs included in the above product
About the 358 attached PDFs for 【BODSOR・mBDSR】
https://www.gogojungle.co.jp/finance/navi/articles/34271
【Master RCI and Win!!】Summary of PDFs explaining mBDSR (Moving Average Filter)
https://www.gogojungle.co.jp/finance/navi/articles/90127
【Master RCI and Win!!】PDF collection for trading using 5-minute signals (Day Trading)
https://www.gogojungle.co.jp/finance/navi/articles/89870
【Master RCI and Win!!】PDF collection for short-term 1-minute trades (Scalping)
https://www.gogojungle.co.jp/finance/navi/articles/88762
【Master RCI and Win!!】PDF collection for 15-minute trades
https://www.gogojungle.co.jp/finance/navi/articles/113513
【Master RCI and Win!!】PDF summary explaining profit-taking points
https://www.gogojungle.co.jp/finance/navi/articles/89471
PDF collection for effectively utilizing R1R2S2【Master RCI and Win!!】
https://www.gogojungle.co.jp/finance/navi/articles/93154
【Master RCI and Win!!】PDF collection to effectively utilize MT5 version of mBDSR
https://www.gogojungle.co.jp/finance/navi/articles/84918
Below, we introduce examples of signals formBDSR (RCI two-filter)signals.
USD/JPY 5-minute chart
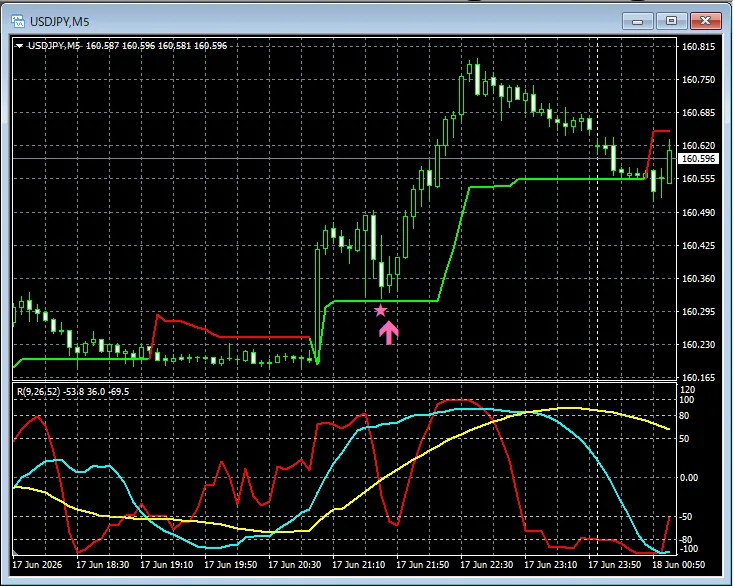
After rising on the FOMCand breaking above the Supertrend resistance line,the dip-buy signal of mBDSR lights up and rises further.
※ Note: In the charts referenced in this article, for ease of explanation, some annotations such as circles, straight lines, and rectangles may be added.
Indicator that shines in combination with RCI【BODSOR・mBDSR】
Methods, case studies (PDF) ★GogoJungle AWARD2020 winner★
https://www.gogojungle.co.jp/tools/indicators/11836
Includes over 550 PDF files (methods and case studies: over 2,000 pages, over 700,000 characters).
Many of them are about logically linking higher and lower timeframes using three RCI lines, then examining multiple lower-timeframe conditions step by step, ultimately waiting for dips on the lower timeframes or rallies (i.e., mBDSR signals).
In addition,they emphasize capturing points where multiple entry reasons overlap.There are many such cases.
Additionally,there are methods that explore upside and downside targets using RCI three-line methodology.
In the PDF explanations,over 1,950 chart pagesare used.

Blacksun Indicators (List)
https://www.gogojungle.co.jp/finance/navi/articles/33779
About Blacksun's free indicators and free e-books
https://www.gogojungle.co.jp/finance/navi/articles/90181
【Reference videos (RCI and mBDSR related)】
Environment recognition using RCI and multi-timeframe analysis to wait for signals (1)
https://www.youtube.com/watch?v=1prvET_M5mA
Environment recognition using RCI and multi-timeframe analysis to wait for signals (2)
https://www.youtube.com/watch?v=vR4oD-oMVQQ
Environment recognition using RCI and multi-timeframe analysis to wait for signals (3)
https://www.youtube.com/watch?v=C6DHn0lD-I4
Environment recognition using RCI and multi-timeframe analysis to wait for signals (4)
https://www.youtube.com/watch?v=QG1iNTnLyyQ
Environment recognition using RCI and multi-timeframe analysis to wait for signals (5)
https://www.youtube.com/watch?v=VYlGiy6Cllg