How to Start Cryptocurrency | Episode 8: Cryptocurrency Price Movement Forecast [Shutaro Fuse]

Compared to fiat currency FX, the price movement of cryptocurrencies is more volatile, so some readers may find it difficult to forecast. This time, we will have Shuto Fudo discuss methods for predicting cryptocurrency price movements.
This article is a re-edited version of an article from FX攻略.com June 2019 issue. Please note that the market information written in the body of this article may differ from the current market.
Shuto Fudo (Fudō Shutarō) Profile

Foreign exchange instructor, writer. Publisher released seminar DVDs and interview CDs. In addition to giving lectures at financial exchanges, securities exchanges, FX companies, and investment trust companies, he also writes for magazines and serves as a school instructor for FX and stocks.
Official site:Shuto Fudo's “Behind the News”
Twitter:https://twitter.com/syutaro_fudo
Be Mindful of Resistance Lines
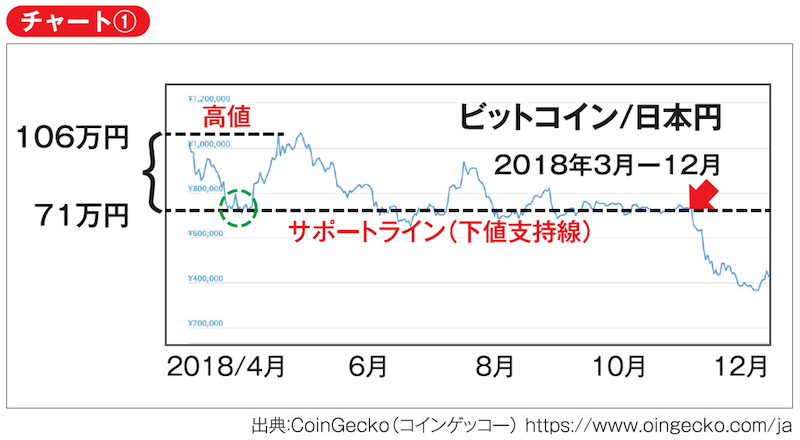
First, please look at Bitcoin’s chart from March 2018 to the end of the year, nine months. Around March 2018 on the left side of the chart, 1 Bitcoin was around 1.06 million yen, but then it sharply fell to the 710,000-yen range marked by the green circle, followed by a rapid rise and then another drop, showing rough movements.
As the Chart ① shows, afterward it continued to fluctuate around 710,000 yen. In other words, around 710,000 yen is a key level in Bitcoin’s market, acting as a support line. In this way, price levels where the market repeatedly reverses become support lines or resistance lines (upper price resistance). Therefore, we draw horizontal lines on the chart and use those levels to predict the market.
In November, as indicated by the arrows on Chart ①, the price fell below the support line. When the support line is breached significantly once, there are fewer investors willing to buy Bitcoin at that time, making further declines more likely. Many investors tend to be mindful of round numbers such as 500,000 yen, so those levels often become resistance lines or support lines.
Technical Using Fibonacci Sequence
There is a famous technical indicator called Fibonacci Retracement, which predicts how far a price will retreat after a stock or currency moves significantly. It is used in equity markets and FX. This originates from the Fibonacci sequence studied by the Italian mathematician Fibonacci. The sequence follows a simple rule: the sum of a number and the next number gives the following number, continuing as 0, 1, 1, 2, 3, 5, 8, 13, 21, 34, 55, 89, 144, 233... From the ratios of those numbers, important Fibonacci ratios are 23.6%, 38.2%, and 61.8%. In investing, these are used by adding 0%, 50%, and 100% to estimate price ranges, reversal points, and market strength.
Most technical analyses and chart readings like Kubota’s five methods forecast the direction by looking at past price movements to predict whether the market is more likely to rise or fall in the near future. By contrast, Fibonacci Retracement is a method that predicts price ranges after a large move, such as how far the price will revert.