Learn How to Create Trading Plans from a Currency Exchange Broker | Episode 26 Incorporating the Three-Wave Theory into USD/JPY Market Analysis (19) [Toshiro Asano]

Toshirō Asano Profile

Toshirō Asano. He has worked at Tokyo Forex, a foreign exchange brokerage within the Toho-Tokyo Group, and at EBS (now ICAP), which boasted over 80% global market share in FX trading worldwide, among other places. He has firsthand experience with historic markets such as the Plaza Accord in 1985, the subsequent era of extreme yen strength, the bubble’s burst, and the euro introduction in 2000, honing his market sense. He later co-founded two FX trading companies and also worked as a dealer for a private FX fund. Currently, he writes for a daily blog on the Investment School Group. Many supporters appreciate his clear video productions that leverage his skill in video editing.
This project is for Toshirō Asano to teach his fully backed selling/buying techniques and market-sense-building know-how drawn from his experience and knowledge. In this issue as well, he will continue to interpret the most recent and future USD/JPY market, and then present the most suitable trading plan.
※This article is a reprint/edit of an FX攻略.com article from June 2019. Please note that the market information described herein is not the same as the current market.
Weekly chart shows continued congestion while daily chart feels reassuring
Summarizing the price action from last issue to now, the market has, for the first time in a month, retraced after a steady move up from the low labeled O, suggesting a pullback. If the rise from O continues, this corrective wave could eventually be ignored, but the initial signal is real, so I’ll revise this month’s chart as well. Let the rebound high after O be P, and the pullback from there be Q. On the weekly chart only one week has passed since Q, so the pullback is weak, but the daily chart seems sufficiently informative.
Additionally, L–Mmid, M–Nmid, and N–Omid are important half-point levels after L and are depicted as the lower bound of the weekly lead-in span, but on the daily chart they have become harder to confirm. Therefore, based on the current price, I have added N–Omid as the support.
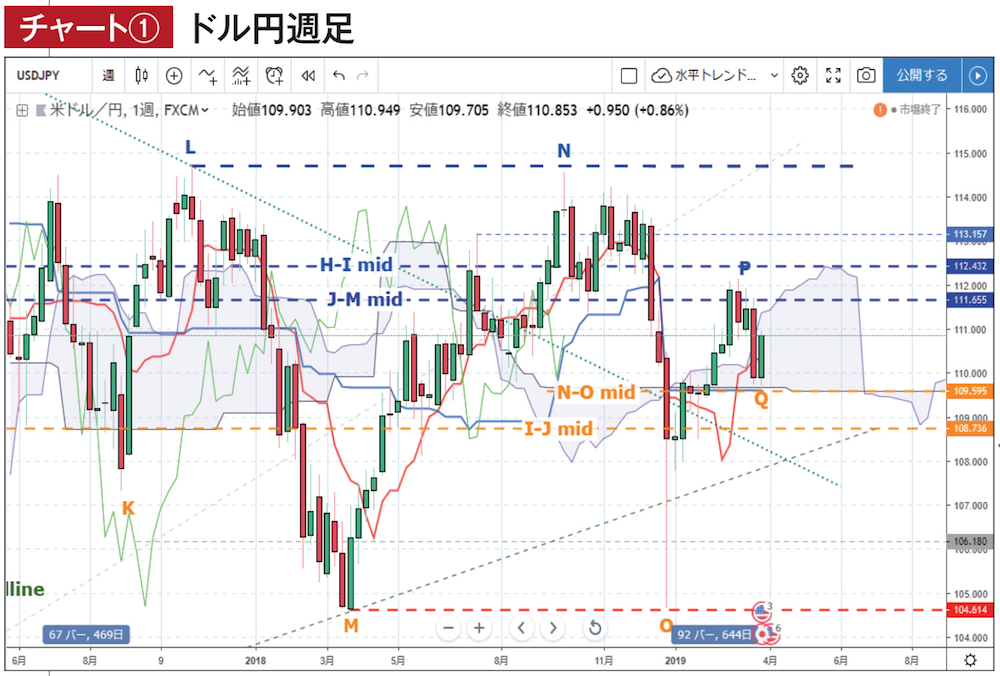
Source:TradingView USDJPY chart
Let’s start right away with the weekly analysis (Chart 1). From last month to this month, there are four bars after P, but the market entered the lead-in span and reversed; though it briefly held at the lower bound, this move caused the lagging span to reverse again, indicating a choppy market. If Q is determined as the pullback for the time being, the level around 109.60–70 yen will serve as a base line, overlapping with the lower bound of the lead-in span N–Omid, and remain valid relative to the lagging span. As long as it can move above this level, a bullish bias can be maintained.
In the near term, choppiness within a relatively thick lead-in span seems likely, and if next week it can be supported by a higher conversion line, it could maintain more than the half-point level of P–Q, and by the time next month’s issue arrives near the P level, there may be a test of an upside break of H–Imid.
Looking at the daily chart (Chart 2), the pullback of P–Q becomes clearer, but except for a temporary dip below the lead-in span at Q, the position remains favorable, perhaps giving more confidence than the weekly chart. However, the conversion line has already reversed and the lagging span remains fragile, so the buy signal is not entirely secure. Ideally, early next week a further dip in the conversion line or the upper bound of the lead-in span, or the baseline under the lagging span, would act as support, enabling a rise toward around the P level.
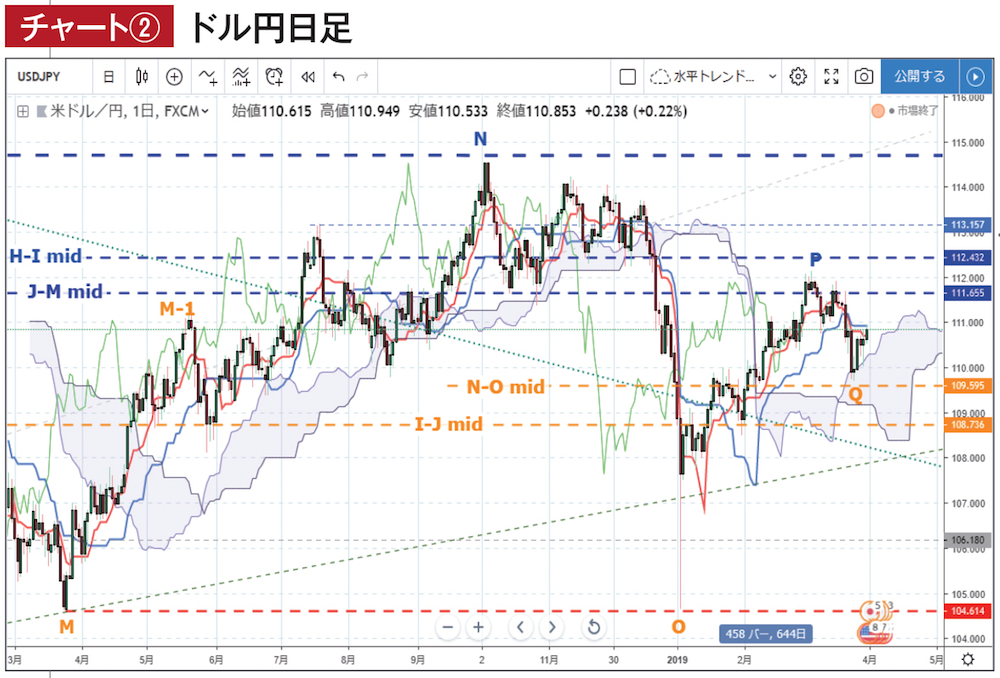
Source:TradingView USDJPY chart