
【Master RCI to Win Big!!】 Super Trend and mBDSR Signals USD/JPY 5-minute chart
【Mastering RCI!! Trend Reversal, Buy Dips, Sell Rallies】
Indicator that shines in combination with RCI【BODSOR・mBDSR】
and methods, case studies (PDF) ★GogoJungle AWARD2020 winner★
https://www.gogojungle.co.jp/tools/indicators/11836
※This product【BODSOR・mBDSR】includes over 550 PDFs (over 2,000 pages, over 1,950 chart images, over 700,000 characters) as methods and case studies.
About the PDFs included with the above products
358 PDFs included with【BODSOR・mBDSR】
https://www.gogojungle.co.jp/finance/navi/articles/34271
【Mastering RCI!!】Summary of PDFs describing mBDSR (Moving Average Filter)
https://www.gogojungle.co.jp/finance/navi/articles/90127
【Mastering RCI!!】Additional PDFs for trades using 5-minute chart signals (Day Trading)
https://www.gogojungle.co.jp/finance/navi/articles/89870
【Mastering RCI!!】PDF collection for short-term 1-minute chart trading (Scalping)
https://www.gogojungle.co.jp/finance/navi/articles/88762
【Mastering RCI!!】PDF collection for 15-minute chart trading
https://www.gogojungle.co.jp/finance/navi/articles/113513
【Mastering RCI!!】Summary of PDFs explaining profit-taking points
https://www.gogojungle.co.jp/finance/navi/articles/89471
PDF collection for effectively utilizing R1R2S2【Mastering RCI!!】
https://www.gogojungle.co.jp/finance/navi/articles/93154
【Mastering RCI!!】PDF collection for effectively utilizing MT5 version of mBDSR
https://www.gogojungle.co.jp/finance/navi/articles/84918
Below, we introduce examples of signals frommBDSR (RCI two-line filter)signals.
USD/JPY 5-minute chart
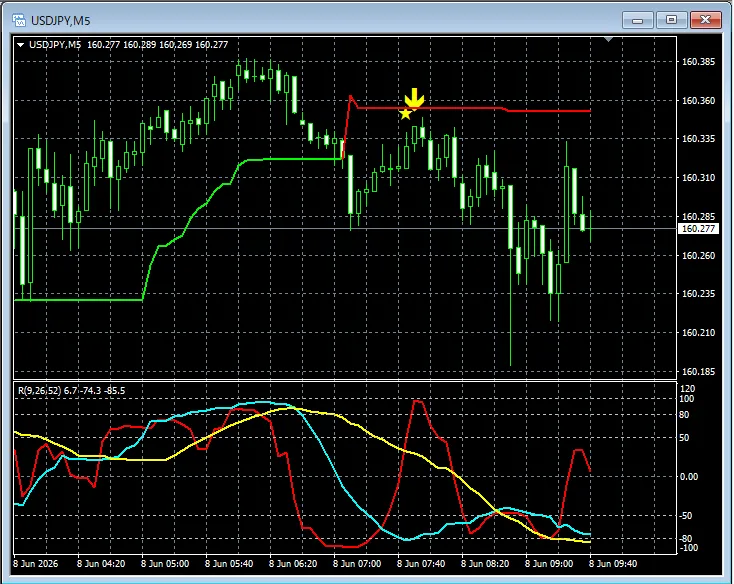
After breaking below the Super Trend support line,the pullback signals ofmBDSRturn on as sell signals during the pullback.
※Please note that in the charts introduced in this article, for ease of explanation, there may be additions such as yen symbols, straight lines, or squares.
Indicator that shines in combination with RCI【BODSOR・mBDSR】
and methods, case studies (PDF) ★GogoJungle AWARD2020 winner★
https://www.gogojungle.co.jp/tools/indicators/11836
Includes over 550 PDF files (methods and case studies: over 2,000 pages, over 700,000 characters).
Most of these are formed as examples that logically link higher and lower timeframes using the three RCI lines, examining multiple lower-timeframe conditions sequentially, and ultimately waiting for Buy Dips or Sell Rallies on the lower timeframe signals from mBDSR.focusing on catching points where multiple entry reasons coincideAlso,
is common.
Additionally,there are methods to explore upside/downside targets using RCI three-lineas well.
In the PDF explanations,over 1,950 chartsare used.

Blacksun Indicators (List)
https://www.gogojungle.co.jp/finance/navi/articles/33779
Free Blacksun indicators and free e-books
https://www.gogojungle.co.jp/finance/navi/articles/90181
【Reference Videos (RCI and mBDSR related)】
Environment recognition using RCI and multi-timeframe analysis to wait for signals (1)
https://www.youtube.com/watch?v=1prvET_M5mA
Environment recognition using RCI and multi-timeframe analysis to wait for signals (2)
https://www.youtube.com/watch?v=vR4oD-oMVQQ
Environment recognition using RCI and multi-timeframe analysis to wait for signals (3)
https://www.youtube.com/watch?v=C6DHn0lD-I4
Environment recognition using RCI and multi-timeframe analysis to wait for signals (4)
https://www.youtube.com/watch?v=QG1iNTnLyyQ
Environment recognition using RCI and multi-timeframe analysis to wait for signals (5)
https://www.youtube.com/watch?v=VYlGiy6Cllg