
Achieve mastery of RCI!! Signals for Super Trend and mBDSR AUD/JPY 15-minute chart
【Master RCI!! Trend Reversal, Buying Dips, Selling Rallies】
Indicator 【BODSOR・mBDSR】 that shines when combined with RCI
and methods and case studies (PDF) ★GogoJungle AWARD2020 winner★
https://www.gogojungle.co.jp/tools/indicators/11836
※This product 【BODSOR・mBDSR】 includes more than 550 PDFs (over 2,000 pages in total, over 1,950 charts, over 700,000 characters) as part of the methods and case studies.
About the PDFs Included in the Above Product
About the 358 PDF files included with 【BODSOR・mBDSR】
https://www.gogojungle.co.jp/finance/navi/articles/34271
【Master RCI!!】 mBDSR (Moving Average Filter) PDFs Summary
https://www.gogojungle.co.jp/finance/navi/articles/90127
【Master RCI!!】 PDF Additions: 5-minute chart signal-based trading (day trading) PDFs
https://www.gogojungle.co.jp/finance/navi/articles/89870
【Master RCI!!】 Short-term 1-minute chart trading PDFs (scalping)
https://www.gogojungle.co.jp/finance/navi/articles/88762
【Master RCI!!】 15-minute chart trading PDFs
https://www.gogojungle.co.jp/finance/navi/articles/113513
【Master RCI!!】 PDFs summarizing points on profit-taking
https://www.gogojungle.co.jp/finance/navi/articles/89471
PDF collection for effectively using R1R2S2【Master RCI!!】
https://www.gogojungle.co.jp/finance/navi/articles/93154
【Master RCI!!】 PDF collection for effectively using MT5 version of mBDSR
https://www.gogojungle.co.jp/finance/navi/articles/84918
Below we introduceexamples of signals for mBDSR (RCI two-filter).
AUD/JPY 15-minute chart
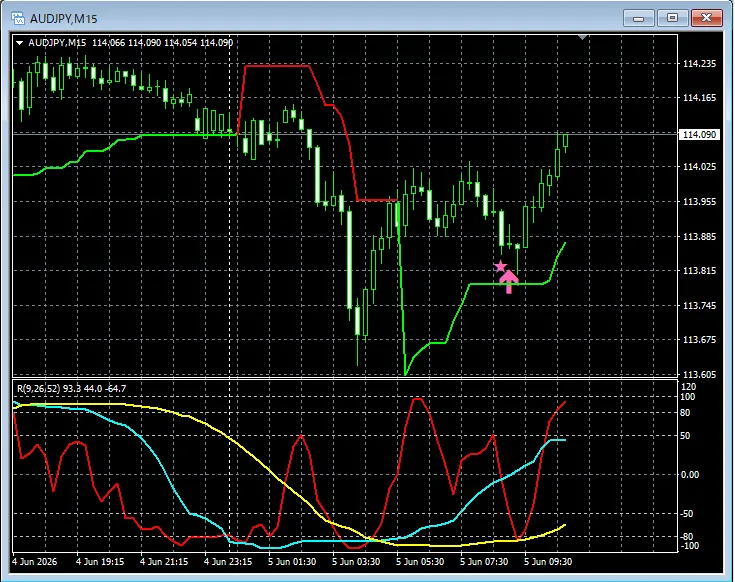
Super Trendafter breaking above the resistance line,mBDSRsignal for dip buying lights up.
※ Please note that in the charts shown in this article, for convenience of explanation, circles, lines, and rectangles may have been added.
Indicator that shines when combined with RCI【BODSOR・mBDSR】
and methods and case studies (PDF) ★GogoJungle AWARD2020 winner★
https://www.gogojungle.co.jp/tools/indicators/11836
More than 550 PDF files (methods and case studies: over 2,000 pages, over 700,000 characters) are included.
Most of them areexamples showing a logical link between higher and lower timeframes using the RCI three-line, sequentially examining multiple lower timeframes, and ultimately waiting for dips in the lower timeframes or pullbacks signals from mBDSR.
Additionally,many focus on capturing points where multiple entry reasons overlap..
Note that,there are methods for exploring ascent and descent targets using three RCI lines..
In the PDF explanations,over 1,950 chartsare used.

Blacksun Indicators (List)
https://www.gogojungle.co.jp/finance/navi/articles/33779
Free Blacksun indicators and free e-books
https://www.gogojungle.co.jp/finance/navi/articles/90181
【Reference Videos (RCI and mBDSR related)】
Forming the sign by environmental recognition and multi-time-frame analysis using RCI (1)
https://www.youtube.com/watch?v=1prvET_M5mA
Forming the sign by environmental recognition and multi-time-frame analysis using RCI (2)
https://www.youtube.com/watch?v=vR4oD-oMVQQ
Forming the sign by environmental recognition and multi-time-frame analysis using RCI (3)
https://www.youtube.com/watch?v=C6DHn0lD-I4
Forming the sign by environmental recognition and multi-time-frame analysis using RCI (4)
https://www.youtube.com/watch?v=QG1iNTnLyyQ
Forming the sign by environmental recognition and multi-time-frame analysis using RCI (5)
https://www.youtube.com/watch?v=VYlGiy6Cllg