
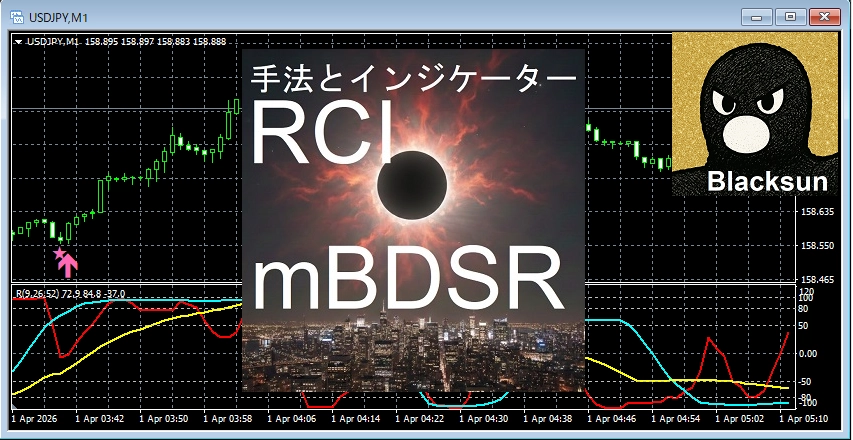
【Master RCI to Victory!!】 AUDJPY higher timeframe double bottom and mBDSR signals
【Master RCI!! Trend Reversal, Buy on Dips, Sell on Rallies】
Indicator that shines when combined with RCI: 【BODSOR・mBDSR】
Methods and case studies (PDF) ★GogoJungle AWARD2020 winner★
https://www.gogojungle.co.jp/tools/indicators/11836
※This product 【BODSOR・mBDSR】 includes more than 550 PDFs (over 2,000 pages in total, more than 1,950 chart images, and over 700,000 words) as method and case studies.
About the PDFs included in the above product
About the 358 PDFs included with 【BODSOR・mBDSR】
https://www.gogojungle.co.jp/finance/navi/articles/34271
【Master RCI to Win!!】Summary of PDFs describing mBDSR (Moving Average Filter)
https://www.gogojungle.co.jp/finance/navi/articles/90127
【Master RCI to Win!!】PDF collection for trading using 5-minute signals (Day Trading)
https://www.gogojungle.co.jp/finance/navi/articles/89870
【Master RCI to Win!!】PDF collection for 1-minute short-term trading (Scalping)
https://www.gogojungle.co.jp/finance/navi/articles/88762
【Master RCI to Win!!】PDF collection for 15-minute trading
https://www.gogojungle.co.jp/finance/navi/articles/113513
【Master RCI to Win!!】PDF collection for 1-hour trading
https://www.gogojungle.co.jp/finance/navi/articles/116353
【Master RCI to Win!!】Summary of PDFs describing profit-taking points
https://www.gogojungle.co.jp/finance/navi/articles/89471
PDF collection for effectively utilizing R1R2S2【Master RCI to Win!!】
https://www.gogojungle.co.jp/finance/navi/articles/93154
【Master RCI to Win!!】PDF collection for effectively using MT5 version mBDSR
https://www.gogojungle.co.jp/finance/navi/articles/84918
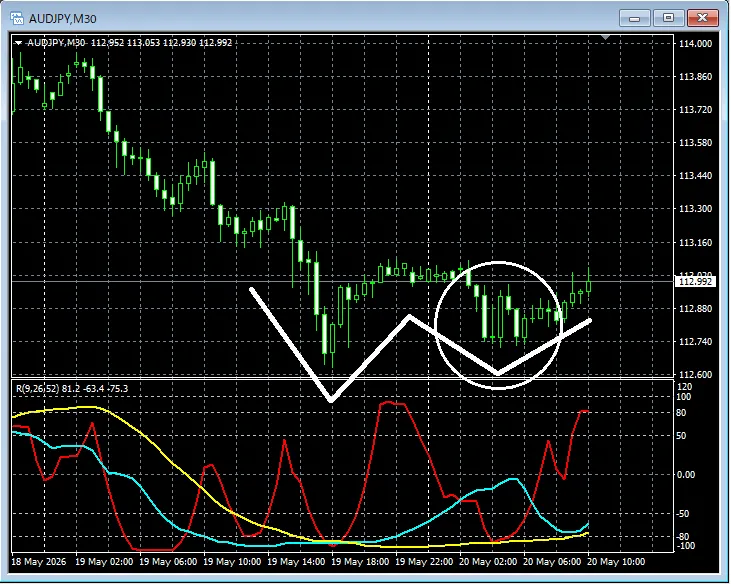
Below, we introduce examples of signals formBDSR (RCI two-filter) signals.
AUDJPY 30-minute chart
AUDJPY 5-minute chart
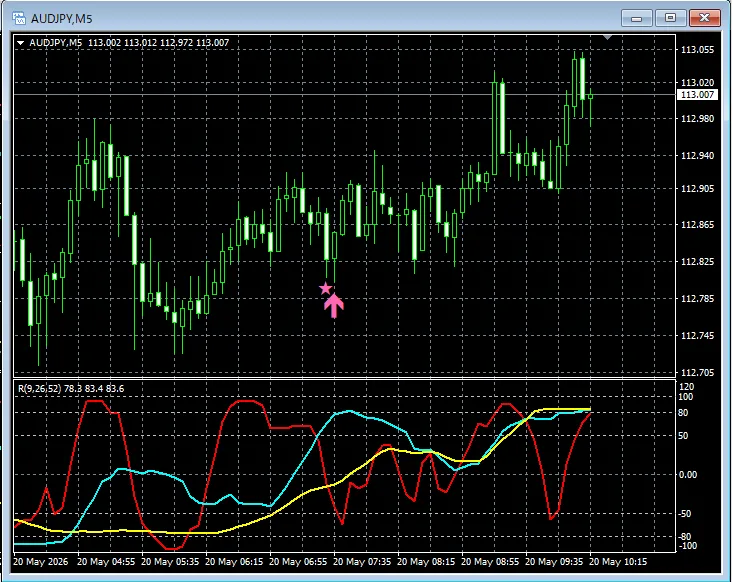
In the above chart, the rise from the right-side valley of the double bottom on the 30-minute chart is well captured on the 5-minute chart bythe mBDSR (RCI two-filter) signal.
When using the Moving Average Filter in the mBDSRas well,combining with the upper-timeframe to lower-timeframe alignment using the three RCI linesallows for high-probability trades. The accompanying PDFs also explain this.
※Please note that the charts shown in this article may have added circles, straight lines, or rectangles for explanatory convenience.
Indicator that shines when combined with RCI: 【BODSOR・mBDSR】
Methods and case studies (PDF) ★GogoJungle AWARD2020 winner★
https://www.gogojungle.co.jp/tools/indicators/11836
Includes more than 550 PDF files (methods and case studies: over 2,000 pages and over 690,000 characters).
Most of them are organized as examples that logically link higher and lower timeframes using the three RCI lines, examining multiple lower-timeframe situations sequentially, and finally waiting for dip-buying or pullback-selling timing (i.e., signals from the mBDSR) on the lower timeframes.
Also,many of them focus on identifying points where multiple entry justifications overlap..
In addition,there are methods for exploring upside and downside targets using the three RCI lines..
In the PDF explanations,more than 1,950 charts are used..

Blacksun Indicators (Index)
https://www.gogojungle.co.jp/finance/navi/articles/33779
Free Blacksun indicators and free e-books
https://www.gogojungle.co.jp/finance/navi/articles/90181
【Reference videos (RCI and mBDSR related)】
Environment recognition and multi-timeframe analysis using RCI to wait for signals (1)
https://www.youtube.com/watch?v=1prvET_M5mA
Environment recognition and multi-timeframe analysis using RCI to wait for signals (2)
https://www.youtube.com/watch?v=vR4oD-oMVQQ
Environment recognition and multi-timeframe analysis using RCI to wait for signals (3)
https://www.youtube.com/watch?v=C6DHn0lD-I4
Environment recognition and multi-timeframe analysis using RCI to wait for signals (4)
https://www.youtube.com/watch?v=QG1iNTnLyyQ
Environment recognition and multi-timeframe analysis using RCI to wait for signals (5)
https://www.youtube.com/watch?v=VYlGiy6Cllg