

【Dollar-Yen】A massive plunge from 160 to 155 yen|Unfolding as expected. What is the next target?
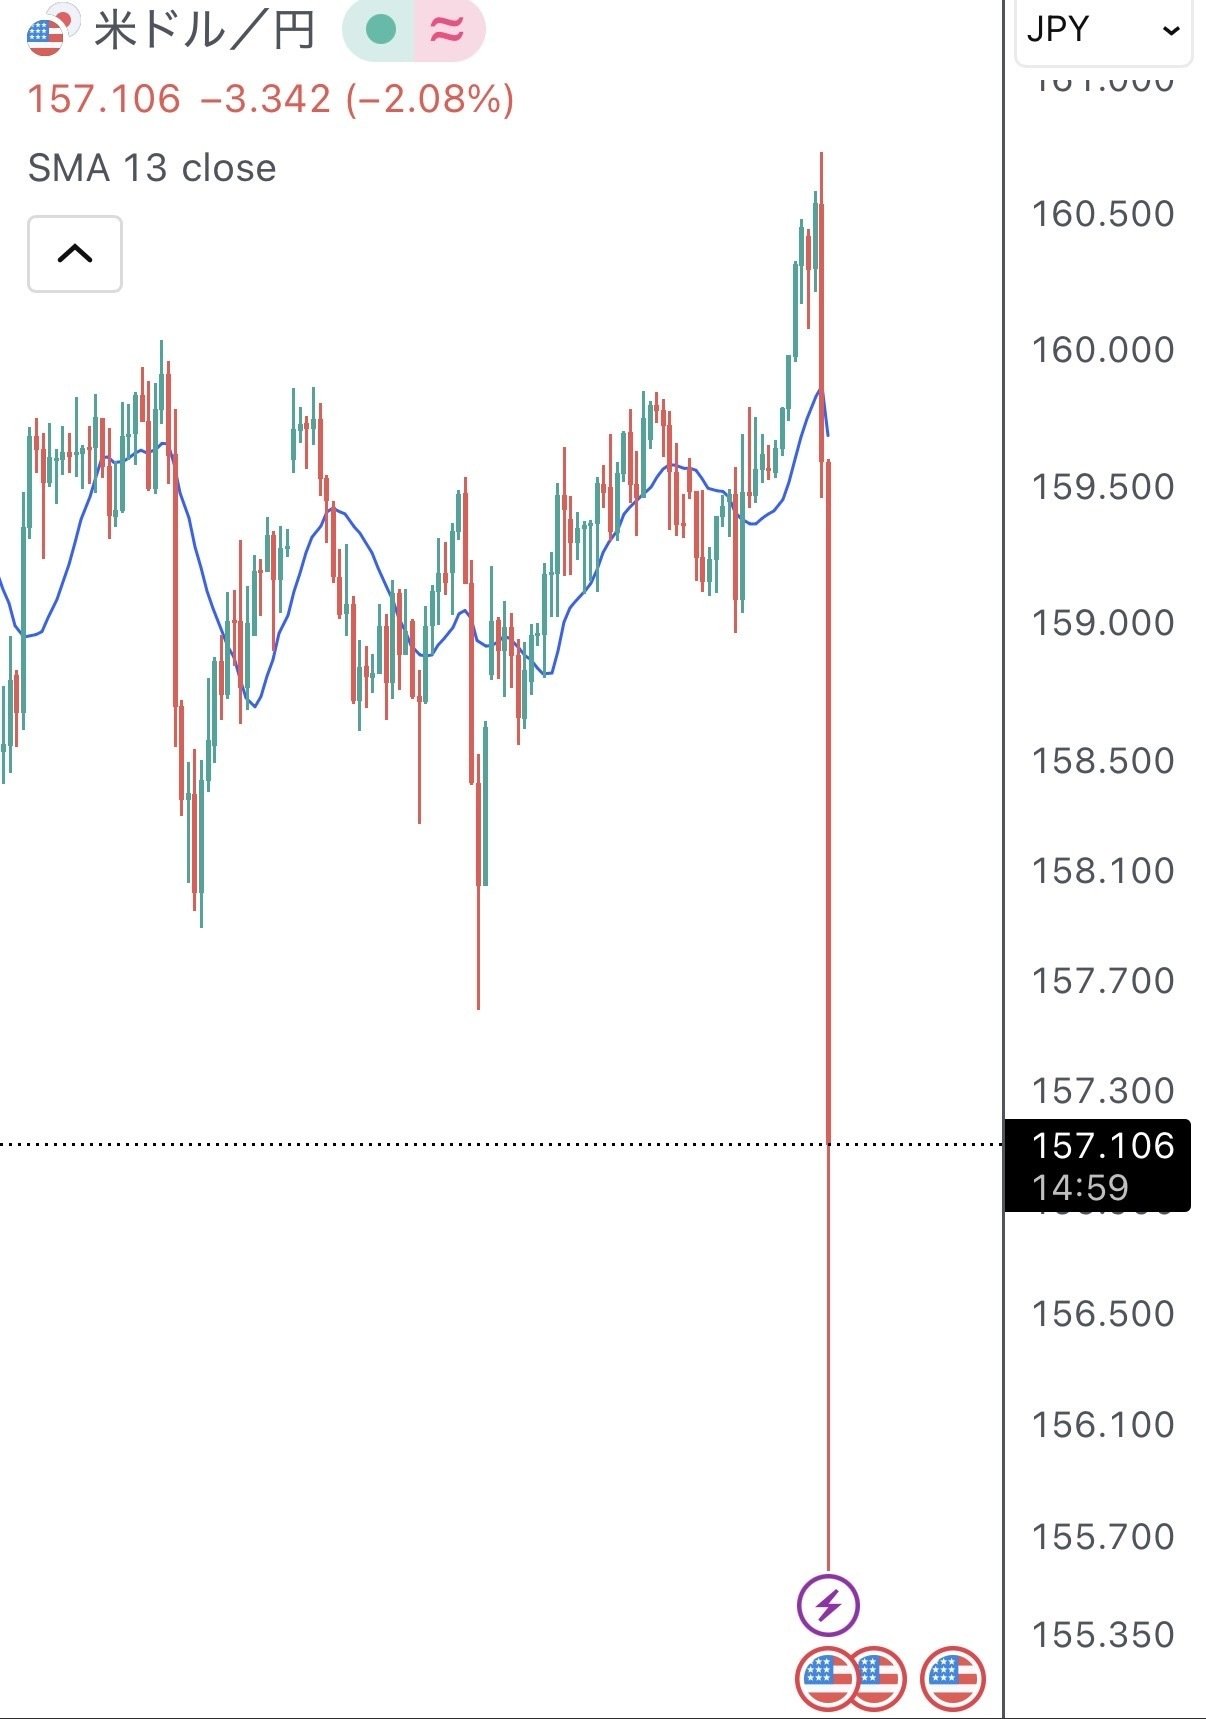
The USDJPY collapsed.
From the 160 yen level, it plunged to 155.7 in one go. About a 5-yen drop.
Do you remember the content I wrote in the note article the other day?
“160 yen is not a wall but a ceiling.”
“A decline will occur upon completing the triple top.”
“Longs at this level are really dangerous.”
“Shorts will eventually be profitable.”
? The previous article is here →https://www.gogojungle.co.jp/finance/navi/articles/115366
Everything happened exactly as written.
Why it hit
Not prophecy or guesswork. If you look at the long-term chart, it was something anyone could understand.
On the monthly chart, it touched 160 yen three times and was rejected each time. It was a textbook triple top in technical analysis. Once this completed, it would fall sharply. I wrote that. And it actually fell.
Furthermore, expectations of Bank of Japan rate hikes, expectations of U.S. rate cuts, and narrowing of the U.S.-Japan interest rate gap. Fundamentals also pointed to yen strength.
When both technicals and fundamentals point in the same direction, the market moves in that direction. It’s a simple thing.
Reasons I warned repeatedly that longs were dangerous
In the past weeks, I’ve written this many times in articles.
“There is no edge for longs from here.”
“There is more edge in shorts than longs.”
“Eventually, shorts will win.”
Honestly, I wrote it relentlessly. But after this crash, I think you’ll understand why I kept saying that.
People who were long in the 160 yen area are now carrying more than 3 yen in unrealized losses. Depending on position size, they may even be forced to exit.
Conversely, those who were short around the 159 yen level are already showing profits of over 200 pips.
This gap is the difference in risk-reward, and it highlights the importance of recognizing where the edge lies.
Characteristics of this decline
There are several features to this drop.
① The speed is fast
From the 160s to 155, it fell almost in a straight line. There was little retracement. This indicates a large amount of sellers. The accumulated energy was released at once.
② New lows are being made
It clearly broke below the most recent low. This is not a range breakout but a sign of trend reversal.
③ Moving Averages turning downward
On the daily chart, the moving averages are starting to slope downward. The perfect order has broken, and the structure is turning into a bearish one.
Next targets
Let's outline the targets from here.
Target 1: around 155 yen
Nearby support zone. A potential rebound could occur here.
Target 2: around 153 yen
A level that will be watched on the monthly chart. This area also appears in the measured move from the neckline of the triple top.
Target 3: 150 yen
Psychological milestone. If it reaches here, everyone will clearly see a real yen-strength trend forming.
However, given how quickly it fell, a short-term rebound is possible. There could be a pause around 157 yen and a move back to the 158 yen range.
Future strategy
① Chasing shorts is not advisable
Fearing to short after it fell to 157 yen is dangerous. It has already dropped about 3 yen. From here, selling risks being caught in a rebound.
② Wait for a pullback to sell
Sell after a brief rebound. If it returns to the 158 yen range, that’s a shorting opportunity. As long as the moving averages remain downward-sloping, the pullback-selling strategy remains in effect.
③ Longs remain not recommended
I understand the urge to try a rebound long, but with a possible downward trend reversal, counter-trend longs carry high risk.
④ Watch the move after the BoJ announcement
If the BoJ policy rate decision is still ahead, a larger move could occur after the announcement. It’s wise to reduce positions before the announcement.
Those who look at the long term win
There is one conviction I’ve reaffirmed with this crash.
People who only watch short-term charts get pushed around. Those who watch the long-term charts catch the direction.
Whether you scalp on M5 or M15 or not, your win rate is completely different if you understand the trend direction on the daily or monthly charts before you start.
This time, the difference between those who could see the 160 yen ceiling and those who couldn’t wasn’t a matter of method. It was the difference of whether they were looking at the long-term chart or not.
【Two selectable courses】
Materials only (19,800 yen)
→ A manual that systematizes 12 years of technique → For those who want to learn at their own pace
https://www.gogojungle.co.jp/tools/ebooks/75266

One-on-one coaching (29,800 yen)
→ Material PDF + community invitation → Real-time market environment recognition
→ Ask Kurama anything you want
https://www.gogojungle.co.jp/tools/rooms/75837?via=users

Honestly, if you’re serious about winning, consulting is the only option. Reading the material and feeling like you understand it won’t compare to actually trading together until you can do it. If you’re unsure, starting with the materials is okay. But,for those who don’t want to take the long route, go straight to consulting from the start.

【Reversal set】
→ Zone detection + reversal signals. When these two align, a reversal is completed
→ For those who want to use reversal as a weapon in addition to trend following
https://www.gogojungle.co.jp/tools/ebooks/78037?via=users_products