

[TEPPAN Intro Part 2] I found a pattern. But for people who cannot decide what comes next
Are you sure this candidate is good to enter now?
With TEPPAN MATRIX and FINAL CHECK
We organize "comparison" and "final judgment"
In Episode 1, we introduced how TEPPAN FINDER instantly draws chart patterns, visualizes entry candidates, stop-loss, and take-profit targets. That alone is already highly practical, but the real 고민 (trouble) comes next.
Which of the found candidates should be prioritized? If the lower timeframes look good but the higher timeframes point the opposite direction, how should we think about it? And even if you can sketch the pattern yourself, how should you assess the quality of that pattern?Quality This time, as Episode 2, we tackleTEPPAN MATRIX and TEPPAN FINAL CHECK.
The MATRIX and FINAL CHECK introduced here play roles in “comparison/selection” and “final judgment” within the TEPPAN series. On the product page, you can see how FINDER / MATRIX / FINAL CHECK interact and what kind of decision flow they create for the entire series.
If you want to grasp the overall picture first, viewing the product page beforehand will help you follow this article.
Problem 1: The lower timeframe looks good, but the higher timeframe is in the opposite direction. Should you really enter?
This is a dilemma many will face. For example, on M15 there is a bearish pattern. But on H1 or H4, the uptrend structure remains. When a signal appears, is it wise to jump in right away?
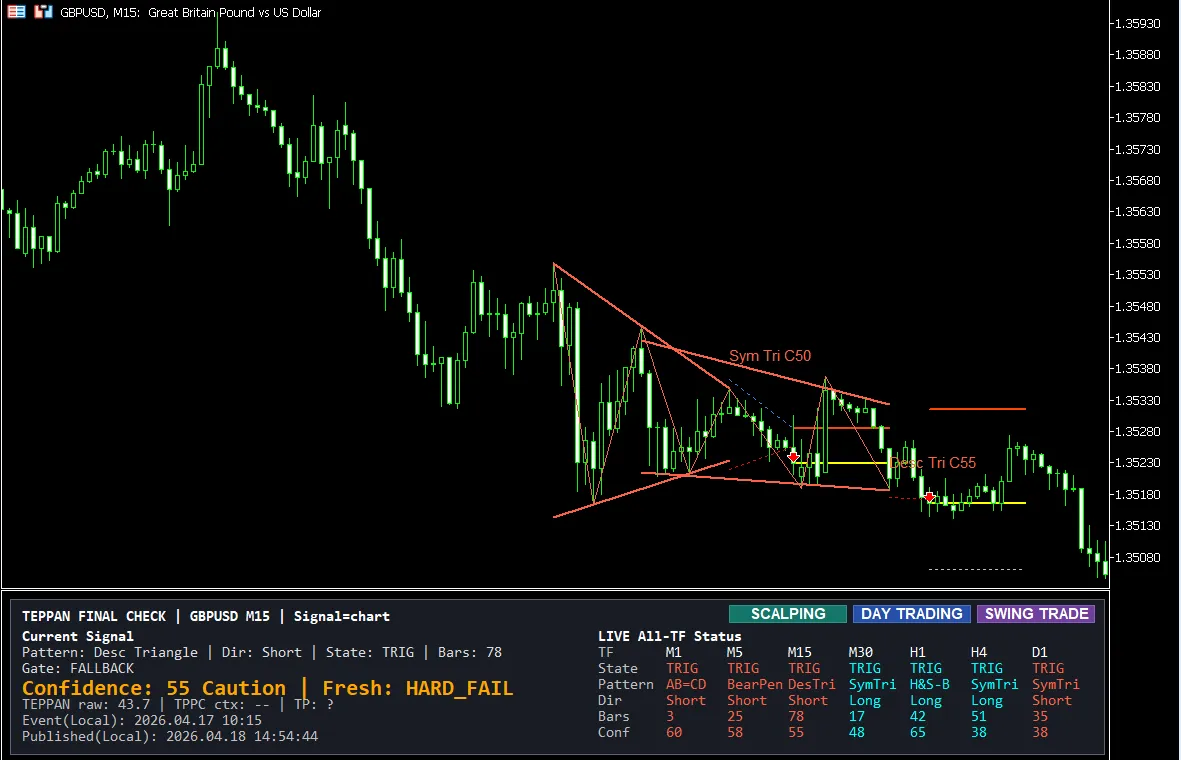
In the attached example, in GBPUSD M15Descending Triangle / Shortis appearing, while on the rightLive All-TF Statusshows that on M30, H1, and H4 there is still a Long bias. In other words,for the near term it might be a sell, but the trend of the higher timeframes is not yet uniform.
Moreover, FINAL CHECK also showsConfidence. This is not a place to make quick judgments by looking at a number alone. Confidence isa composite score considering pattern quality, state, freshness, and TriParity context as needed, categorized into High / Medium / Caution / Low to indicate how well the current hypothesis is formed.
Additionally, reading these displays can feel a bit dense until you get used to them. Therefore FINAL CHECK providesAI prompt output. Also, using the SCALPING / DAY TRADING / SWING TRADE buttons on the top-right, you can switch the evaluation lens by trader style. When outputting, you should provide both a text file and a screen capture to the AI.
Problem 2: Which currency pairs have opportunities? Opening each one manually is inefficient.
Here is another worry: “I don’t necessarily only trade one currency pair, but I don’t know where the opportunities are.” So people end up opening the main chart one by one to check. Often, many will end up with misses, wasting time and focus.
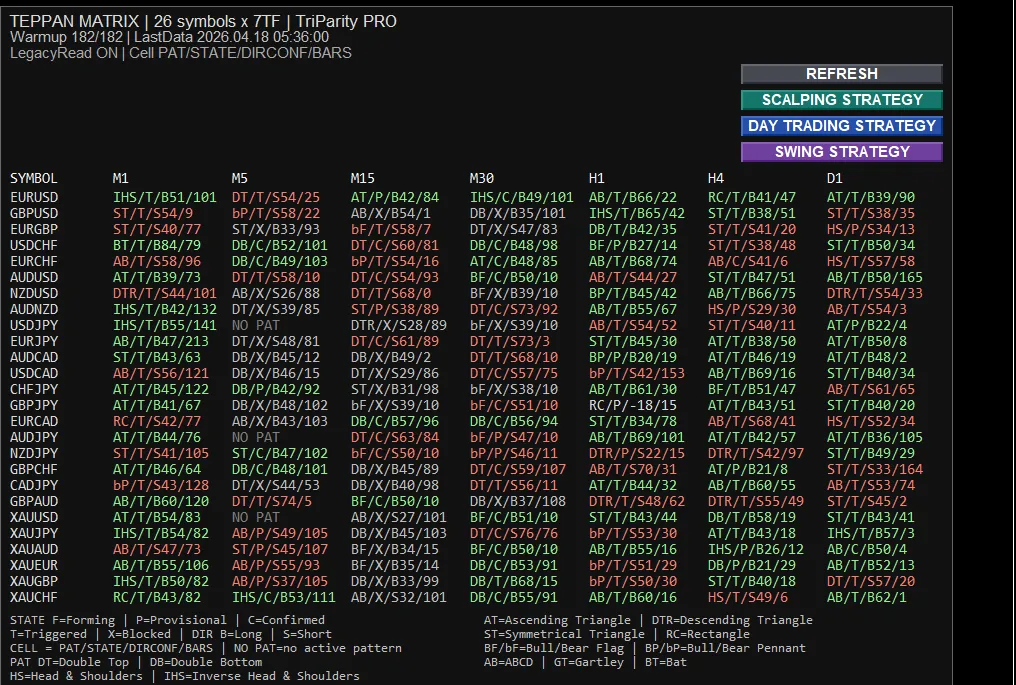
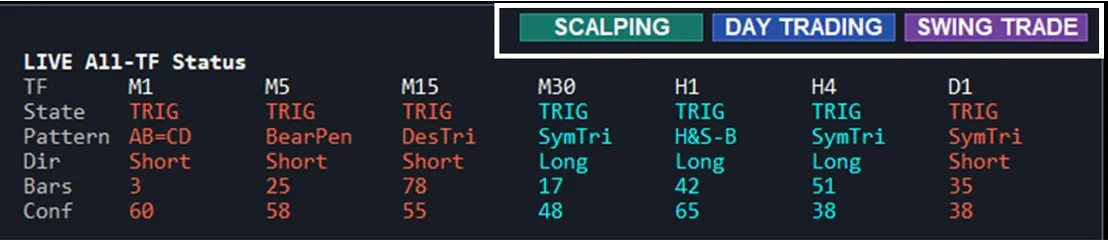
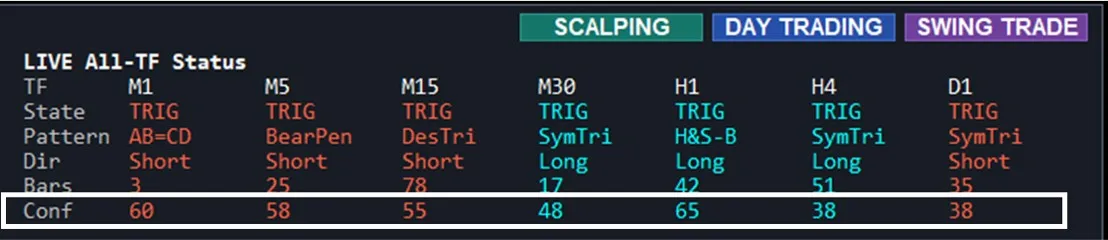
The answer to this concern isTEPPAN MATRIX. MATRIX is a market-overview dashboard based on all 26 symbols × M1〜D1, and you can narrow monitoring targets to FX ONLY / GOLD ONLY / CUSTOM. Each cell is displayed asPAT / STATE / DIRCONF / BARS, with green leaning long, red leaning short, and gray indicating weak or neutral direction, giving a rough read at a glance.
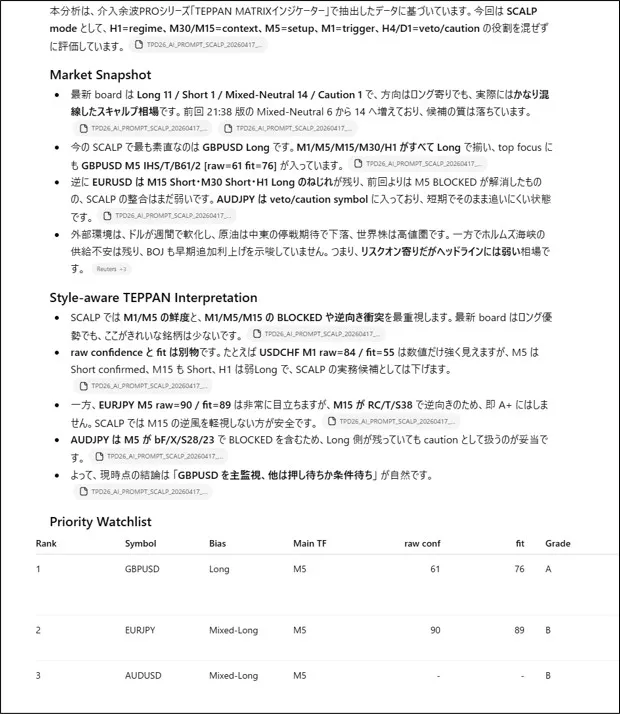
Indeed, at the top of MATRIX there areSCALPING STRATEGY / DAY TRADING STRATEGY / SWING STRATEGYAI output buttons, which help organize market-wide overview, extract priority watch candidates, and sort waiting/omission candidates. In the attached SCALP analysis example from 2026-04-17, the AI report highlightsGBPUSD Longas the most straightforward candidate.
What’s important here is not that AI gave the answer, but thatit converts dense information from the list view into readable text and a watchlistfor humans to read.
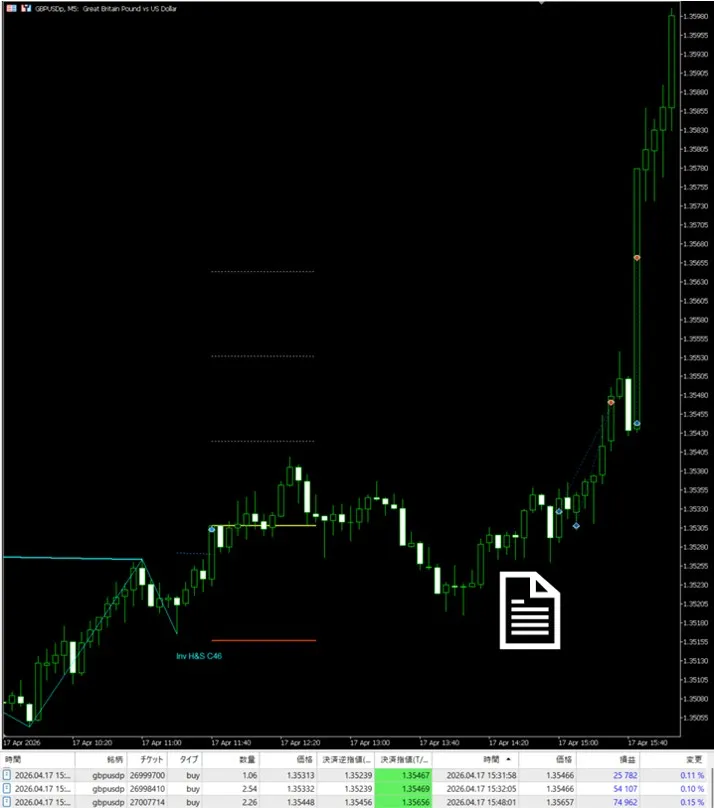
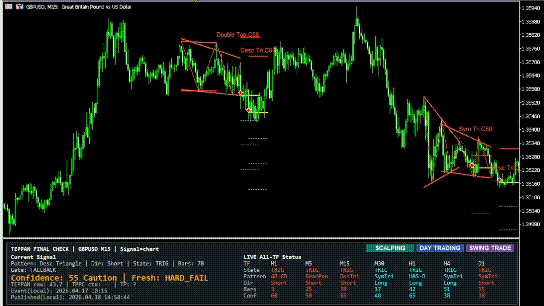
In the attached GBPUSD M5, a blueInv H&Sappears and then moves up. From this flow, MATRIX’s role is not just “listing” but tocompare the entire market → organize priorities with AI → refine on individual chartsto improve efficiency. Of course, this is still analytical support. AI output is not meant to replace the trader’s judgment but to reduce misses and make comparing candidates easier.
Problem 3: I can draw patterns myself now. But how do I judge their Quality?
This is a concern that resonates with both beginners and veterans. You train hard and can sketch double tops, H&S, triangles, etc., but whether that pattern is truly good is not always clear.How good is the shape?Sometimes you don’t know until you assess.

So what you should look at isConfidence Score. However, Confidence is not a simple score of whether a pattern exists. Confidence isa comprehensive score that factors in pattern quality, state, freshness, and TriParity context as needed.
On top of that, Confidence also factors inwhether it is forming, provisional, confirmed, triggered, or blocked andhow many bars back the signal is, i.e., freshness. In other words, the same pattern can have different meaning depending on its current stage.
In display, these fall intoHigh / Medium / Caution / Lowbands. High indicates a relatively well-formed state, Medium indicates room for consideration, Caution warns about chasing or headwinds, and Low is more about waiting. In other words, Confidence is not about presence or absence but about how well-formed it is.
This is the key point.Having a pattern and objectively judging its quality are separate skills. TEPPAN supports the second with Confidence.
TEPPAN FINDER from Episode 1was about “finding.” This time, TEPPAN MATRIX and TEPPAN FINAL CHECK support the next step ofcomparing, narrowing, and making the final judgment.
And in Episode 3,“Intervention Aftermath PRO”will be combined to explain why the same pattern can have different evaluations and delve into internal coherence. By then, TEPPAN will feel less like a mere pattern display and more like a series that helps organize discretionary judgment to a higher level.