

Is the trending paper "Japan-US Industry Lead-Drag Strategy" really usable? The true nature of 23% annual rate and its pitfalls
When you hear about a “23% annualized return,” how do you feel? Wow, I want to try it, maybe I can earn too… Such expectations may swell.In fact, a research group at Osaka Metropolitan University announced an investment strategy using the time difference between Japan and the United States called the “Japan-US sector lead-lag strategy,” which recorded strong performance in historical data.
However, let’s think about it a little more calmly.
Will those profits really be able to be earned by you in the same way? In conclusion, the returns in this paper are unlikely to be reproduced as-is.
The numbers look attractive, but in actual trading there are underlying assumptions and discrepancies that are not visible.This article will organize in order the contents of the paper, the reasons it cannot be used as-is, and practical ways to use it.
Selling well!A high-functionality trading practice tool that feels like the real thing?9,800 yen?
?FX New Generation: One-Click FX Training MAX
?“If America moves, Japan will move” A story expressed in equations
One reason this study became a topic is that by feeding the paper’s content to generation AI, codification and replication became relatively easy and drew attention.
This paper is titled “Japan-US Sector Lead-Lag Investment Strategy Using Partial Space Regularized Principal Component Analysis” by Kei Nakagawa and others at Osaka Metropolitan University. Co-authors include Yuki Takemoto, Keiji Kubo, and Makoto Kato.
The verification period is 2010 to 2025. The results show about 23% annual return with a maximum drawdown of about 9.58%.
The strategy is simple. It assumes that sectors that rose in the American market are more likely to rise in the Japanese market the next day, so you buy at the morning open and sell at the close. The idea is to capture the daily price range repeatedly.
In other words, it is a strategy that takes advantage of a time lag when the influence of the American market is not fully priced in yet. This isn’t a particularly novel idea, andmany investors intuitively understand this kind of movement.
In fact, coverage often notes that “Japanese related stocks were bought following the rise in U.S. semiconductor stocks.”In other words, the essence of this strategy is not about a new discovery but about numerically validating an existing market movement.

?“Looks easy” but is actually an impossible game
The appearance is simple, but reproducing it in reality is not easy.
First, you need to gather U.S.-Japan sector ETF data, adjust for business-day differences, and structure it as time-series data. Then you must compute correlations every 60 business days and perform principal component analysis.
In other words, it is difficult to handle with general tools, and requires analysis environments like Python. While these programs can be generated by AI, gathering and cleaning past data and building the execution environment are not something anyone can easily set up.
Another important point is that this paper is not entirely data-driven.
λ (lambda) = 0.9 is used as a parameter, meaning 90% of the model is human hypothesis and 10% is data. They pre-embed structures such as the tendency of the same direction movement between Japan and the U.S., and the existence of cyclical and defensive stocks depending on the economy.
In other words, it isn’t something that can be easily reproduced with AI; the design of what kind of structure to include is itself important.
?“Winning but losing” The trick behind it
The biggest reason you cannot use this paper as-is is the difference in executed prices.
The paper assumes buying at the open and selling at the close. But in reality you cannot always buy at the same price.
For example, if the U.S. market rose the previous day, the buy orders at Japan’s opening tend to flood in. As a result, the opening price may jump considerably.
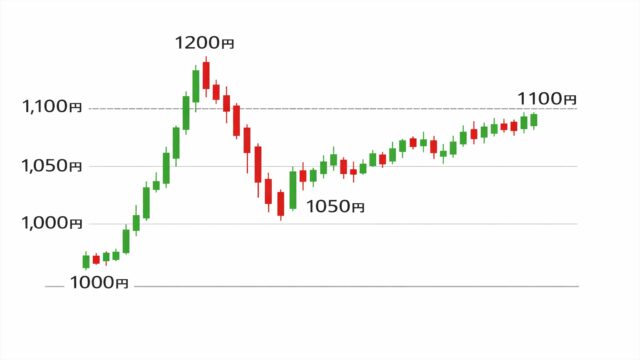
Even if the data show an opening price of 1000 yen and a closing price of 1100 yen (+100 yen), in reality there are cases where the price spikes at the open to 1200 yen, trades, and then drops to 1100 yen by the end of the day.
In such cases, the data may show a profit, but an investor who bought at 1200 yen would incur a loss.
Therein lies a big discrepancy.
The opening is a time when orders cluster and prices can jump, and slippage is common; for individual investors, it is the most disadvantageous timing.
In other words, the assumption in the paper that you can buy at the opening price itself is often not achievable in reality.

?Ultimately, who is taking this profit
Then who profits from this strategy? Primarily institutional investors and algorithmic traders.
They can trade at favorable prices due to fast order processing and pre-positioning. Meanwhile, individual investors place orders after seeing information, making them more likely to be late to react.
As a result, while averages may show profits, many participants trade at unfavorable prices and tend to incur losses.

?How to correctly use this paper
So, is this paper meaningless? Not exactly.
The important point is not to use the strategy as-is, but to apply the underlying thinking.
Instead of jumping in at the open, observe the moves after the opening and confirm whether the trend will continue. Then enter by following the pullback or the moving momentum—this is more realistic.
What this paper shows is that there may be some bias in intraday price movements.
The numbers in the paper reflect ideal conditions; in real markets, execution slippage will occur. The profits you can see and the profits you can actually achieve often do not match.
This paper is not about a profitable method itself, but about using it as material to understand market structure. How do you think you can apply this paper?
Completely risk-free trading simulator for自由に練習&検証!
Details page for One-Click FX Training MAX