

【1/30 4 matches 3 wins 1 loss +2436 pips】GOLD trade commentary — determining the entry point by connecting with the lower timeframe after a major crash.
Today I will talk about the design to avoid hesitation at the right edge.
SMC, ICT, CRT.
So far, over three installments, I have written about why you can’t win even if you know the theory.
So, in the end, how can you stop hesitating at the right edge?
The answer is simple:reduce in advance what you think about when you come to the right edge of the chart.
Many people try to think of everything from scratch at the right edge of the chart.
“Which direction is it now?” “Will it rise or fall from here?” “What is this pattern?”
If you do this at the right edge, you get confused.
My method is to decide the scenario on a 30-minute chart, and on the 1-minute chart only confirm the entry trigger.
What you think at the right edge is only whether the current shape matches your scenario.
If YES, enter. If NO, pass.
Prepare in advance so you can focus only on this judgment.
This is the design philosophy of this method.
In SMC, where the order block is located.
In ICT, where the FVG or breaker block is located.
It is good to do such analyses in advance.
But if you try to confirm everything at the exact moment at the right edge, it collapses.
Separate what you decide in advance and what you judge at the right edge.
Whether you can do this separation is the decisive difference between people who hesitate and those who don’t.
Next time is the final chapter. I will write about “18 years of not changing.”
Why I have continued with the same method for so long.
I will tell you the essential reason.
This content will progress quickly for those who already possess GOLD, so please acquire it now.
If you leave it until later, you may not catch up.
As a bonus, I have also developed a powerful tool.
From now on,as a subscriber-only perk of Investment Navi+it will evolve.

Now, onto the main topic.
As I have said many times, in this Investment Navi+ we explain in detail how to recognize the barriers and how to combine higher and lower timeframes.
↓ Here is the approach that improves the problems in trades
https://www.gogojungle.co.jp/tools/ebooks/50406
From here on, we move to the usual article.
It features an ON/OFF function to overlay higher time frames.
https://www.gogojungle.co.jp/tools/indicators/73674
Complete Edition [Trading Wall]
https://www.gogojungle.co.jp/tools/indicators/73688
Trading walls will evolve further in the future, so please look forward to it^^
If you purchase now, you will receive future updates for free.
Trading Wall is not used alone; when paired with a cure, it becomes a powerful weapon!
https://www.gogojungle.co.jp/tools/ebooks/50406
--------------------------------------------
**10/20 release** [Free gift available] Major entry triggers revealed!
Classic trades fall into one of these three categories.
https://www.gogojungle.co.jp/info/23295
↑Get it now while you can
--------------------------------------------
◆Recommended free Investment Navi+
This is the Holy Grail! The art of review
https://www.gogojungle.co.jp/finance/navi/articles/98909
Concrete ideas for outputs
https://www.gogojungle.co.jp/finance/navi/articles/98980
How to break through when growth stalls
https://www.gogojungle.co.jp/finance/navi/articles/99544
--------------------------------------------
In this article, I will also write about the dense content posted in the community, along with behind-the-scenes and the big picture^^
If you can engrain this content now and make real-time judgments
it may not be an exaggeration to say you’ve won life haha
I have written in detail so you can understand the shift in perspective and the big picture^^
※ Also, from this time, how I viewed the 30-minute chart
I plan to describe the connection from macro to micro perspective.
So that you understand what you think and for what purpose you trade
I hope.
If you want to see the community directly or want to know more about trading methods,
please purchase the manual.
https://www.gogojungle.co.jp/tools/ebooks/50406
From here on, I plan to fix the beginning so that you check every day, so I might keep it fixed at the top haha
The goal isto be able to instantly judge the current situation when you look at a chart.
It is written that you do not watch for a long time, since you trade while living your life, so by looking at the chart and deciding whether you should trade now, you will be able to set how long to wait using MA as a guide.
If you consider each candle as the current moment, think about what you should consider to recreate that one chart yourself, andcover the right side of the yellow arrowand look, you will see a standard for judging at the right edge no matter which point in time you look at^^
Then, you can simply rewind your chart display, stop at the point you captured, and take a screenshot of that single image to practice judging within that image. This is past validation.
↓↓ Now, from hereonly in this serialized Investment Navi+please view the explanations^^
↓ I will attach a video about handling the 30-minute chart.
Video Series, three works (technically four)I will specially attach this time. This is already in the manual, but I have made that part easier to understand. From now on, I will link to YouTube, so it should be easier to play.
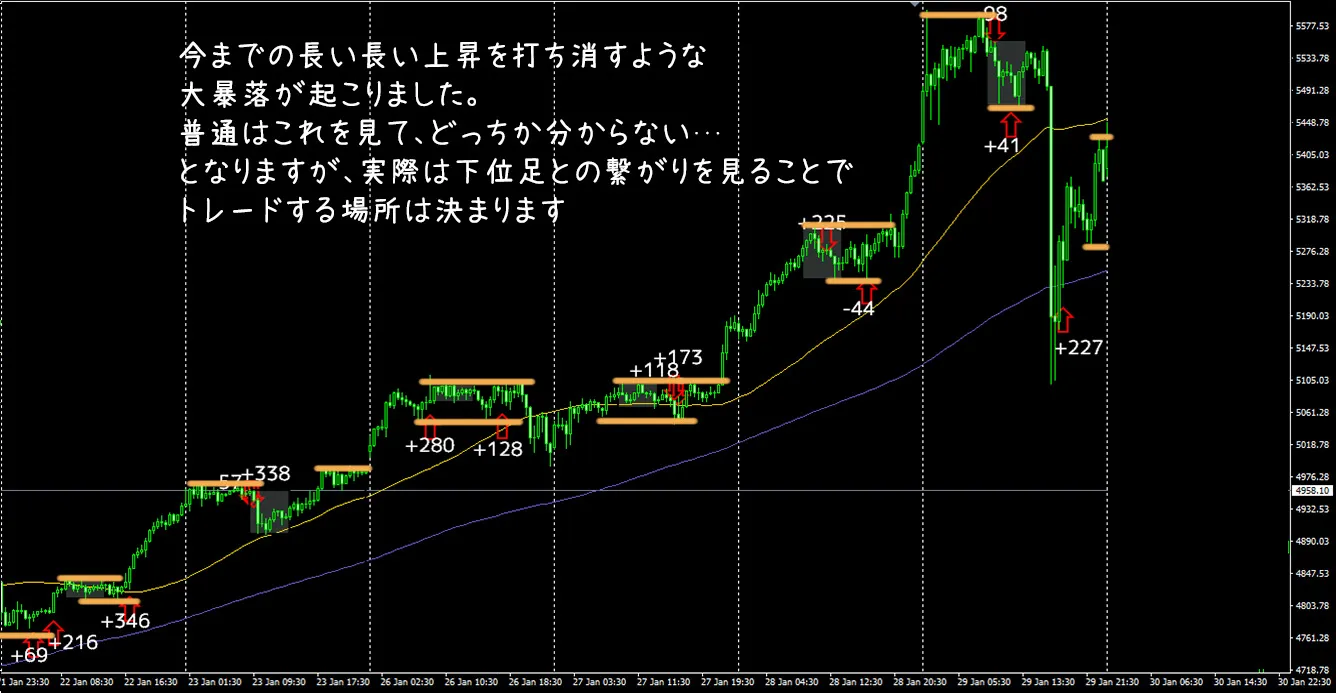
After a long rise, a big crash occurred.
But what you do is always the same.
Check the wall position and wave state on the 30-minute chart, then look for the place where the one-minute chart forms.
After a big move, carefully watching the connections with the lower timeframes reveals where to trade^^
I have included images posted in the community, but please direct explanations and questions to the community^^
1/30
4 wins 3 losses, +2436 pips (+1539 / +641 / +541 / -285)
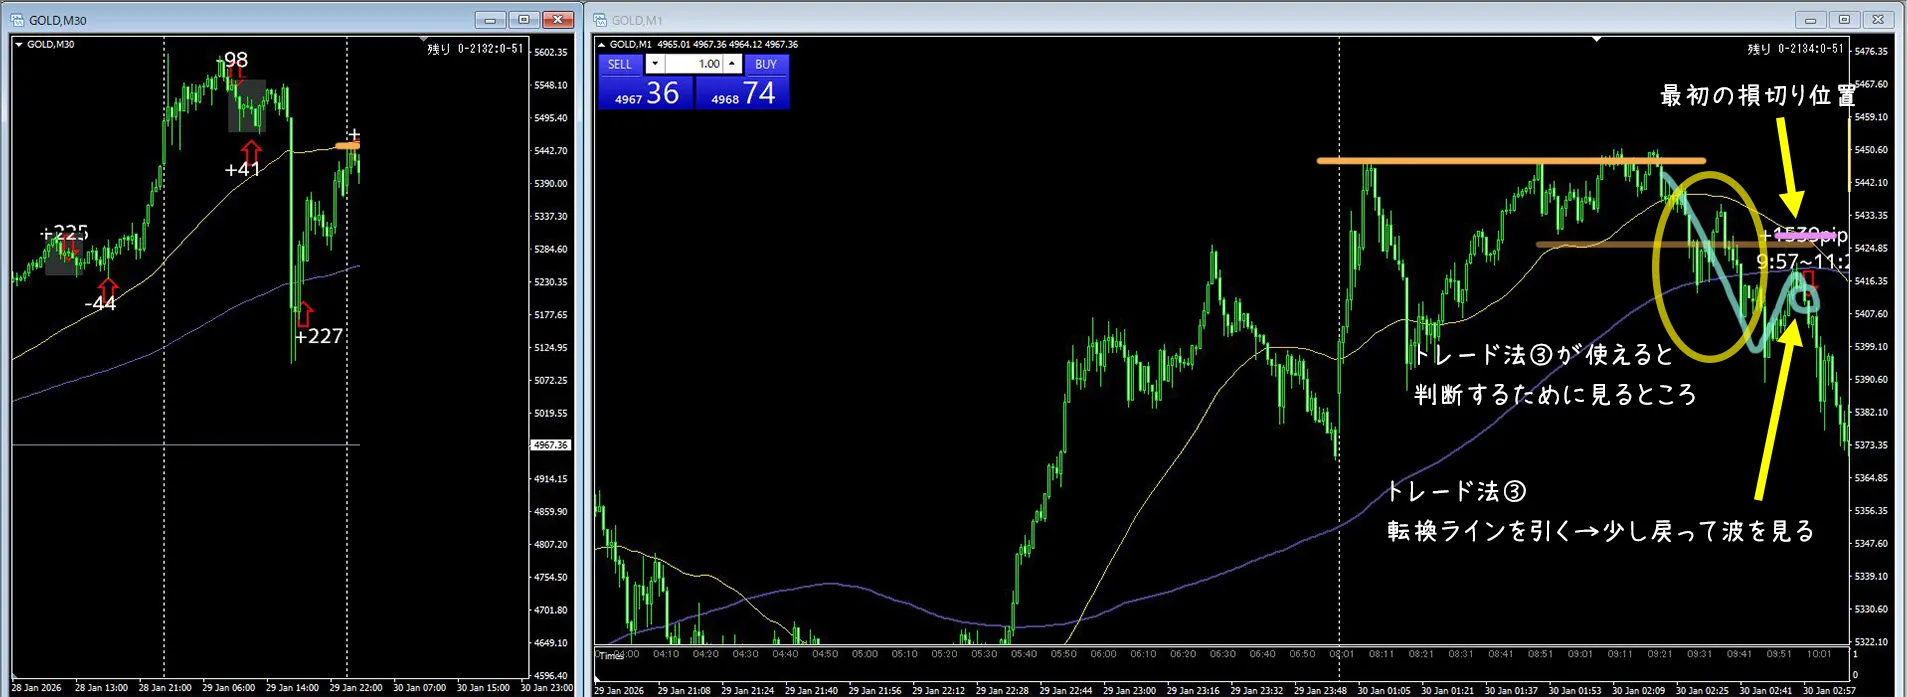
When looking at the 30-minute chart, it shows a moment where the momentum has slowed and turned down.
On the 1-minute chart, to decide whether Entry Method ③ can be used, draw a turning line and observe a slight retrace.
The initial stop-loss location is around above this area.
Entry at 9:57^^
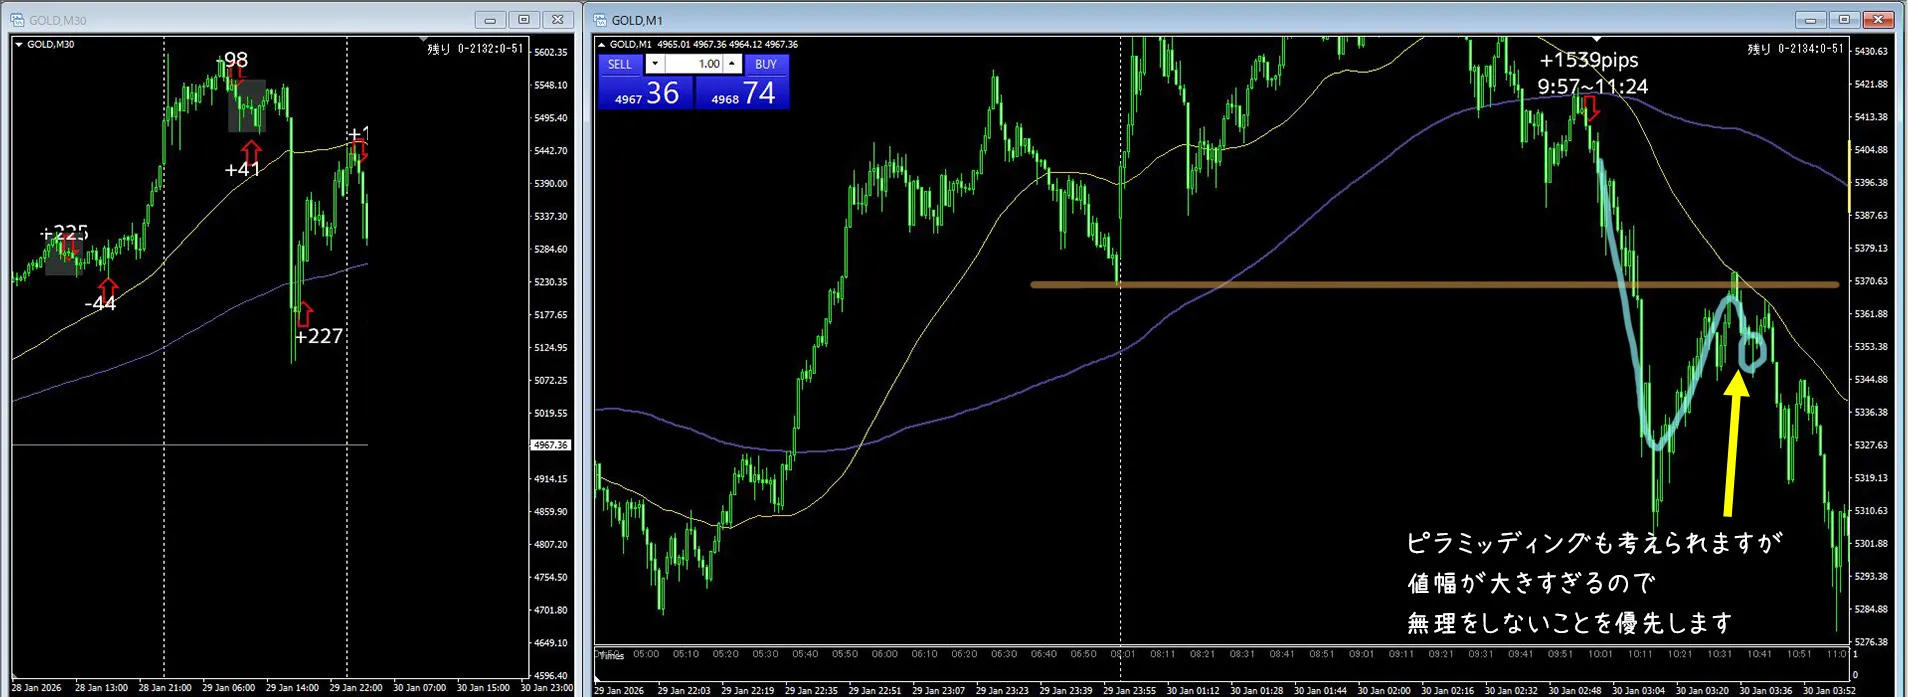
After entry, it dropped properly.
Pyramiding is possible, but the range is too large, so prioritize not forcing it.
Chasing in such a situation causes a quick pullback.
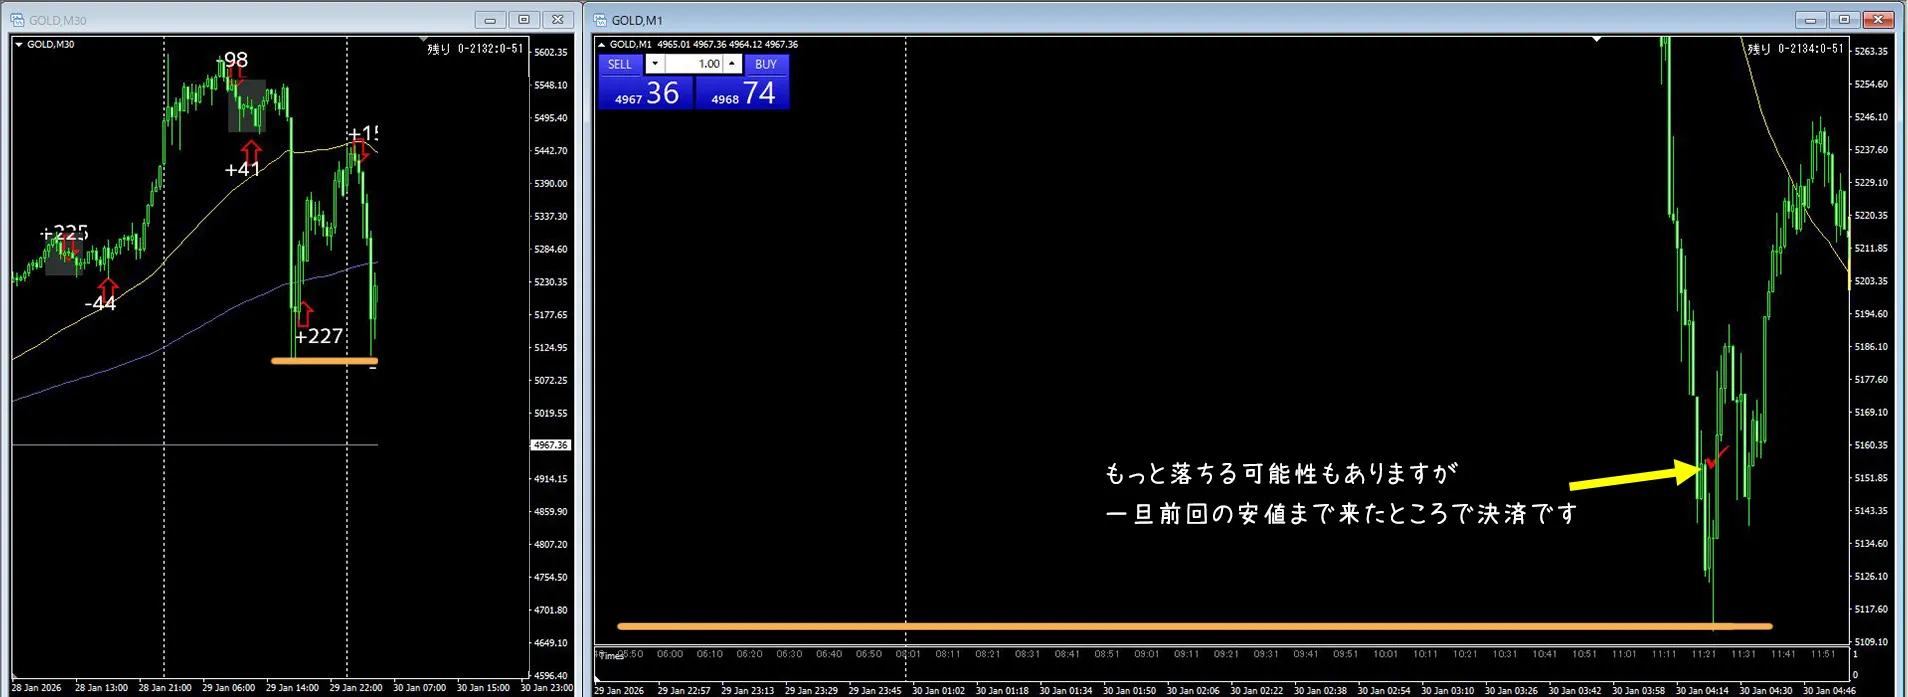
It could fall further, but I took profit as it reached the previous low for now.
+1539 pips (9:57–11:24) is a great feat haha
It is important not to push for more when you could already exit at a clear target.
If there is a clear previous low as a target, exiting there is a stable method^^
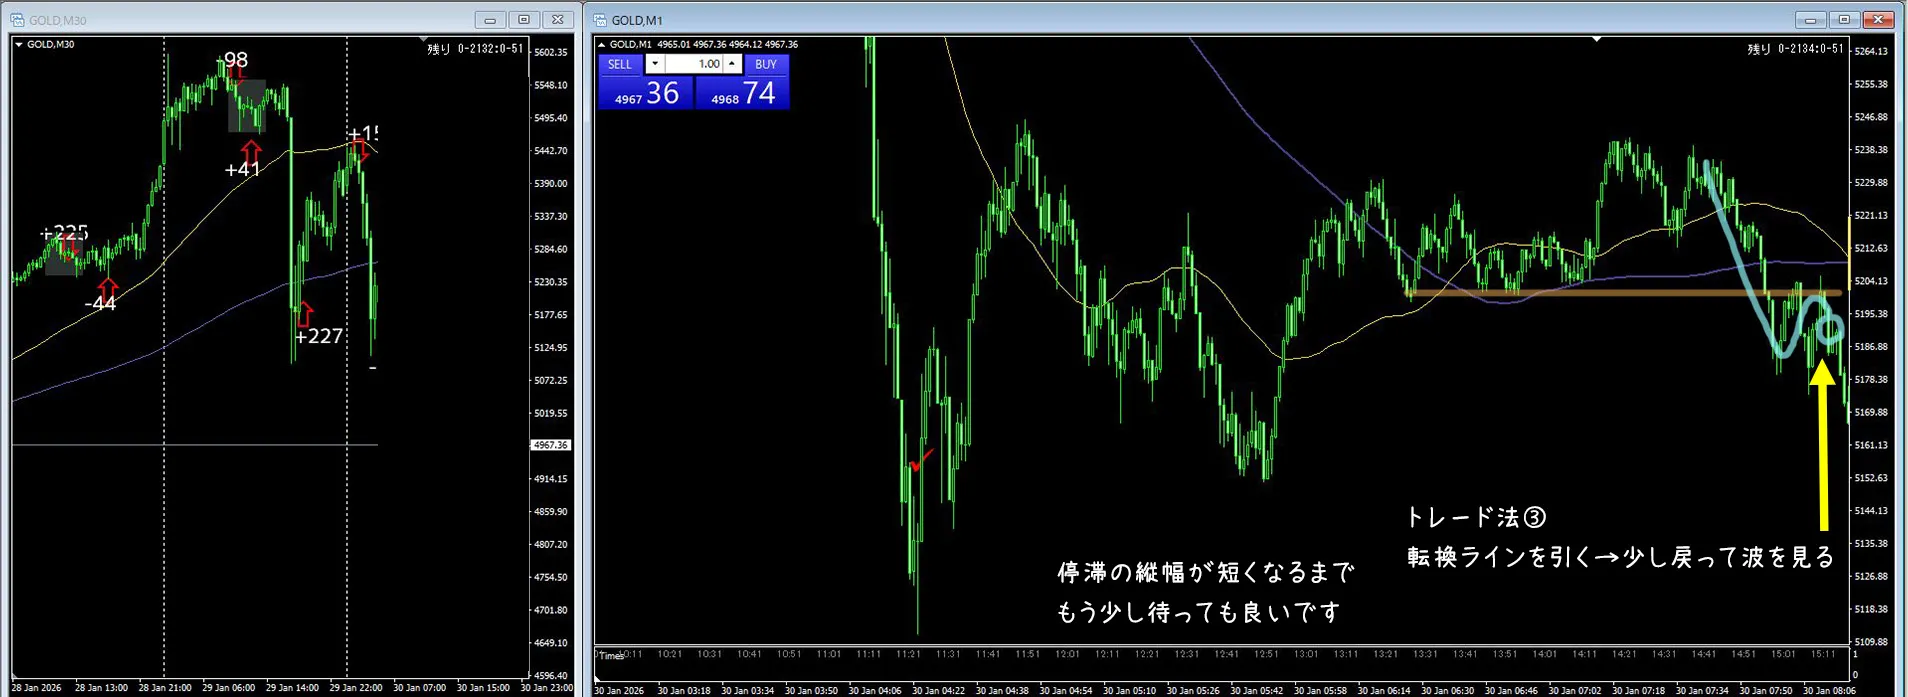
Post-exit scene.
From here I will see whether Entry Method ③ can be used, but the vertical width of stagnation is still large.
It may be better to wait until the vertical width shortens a bit more.
Rather than rushing in, wait for the shape to align, as it yields a higher expected value.
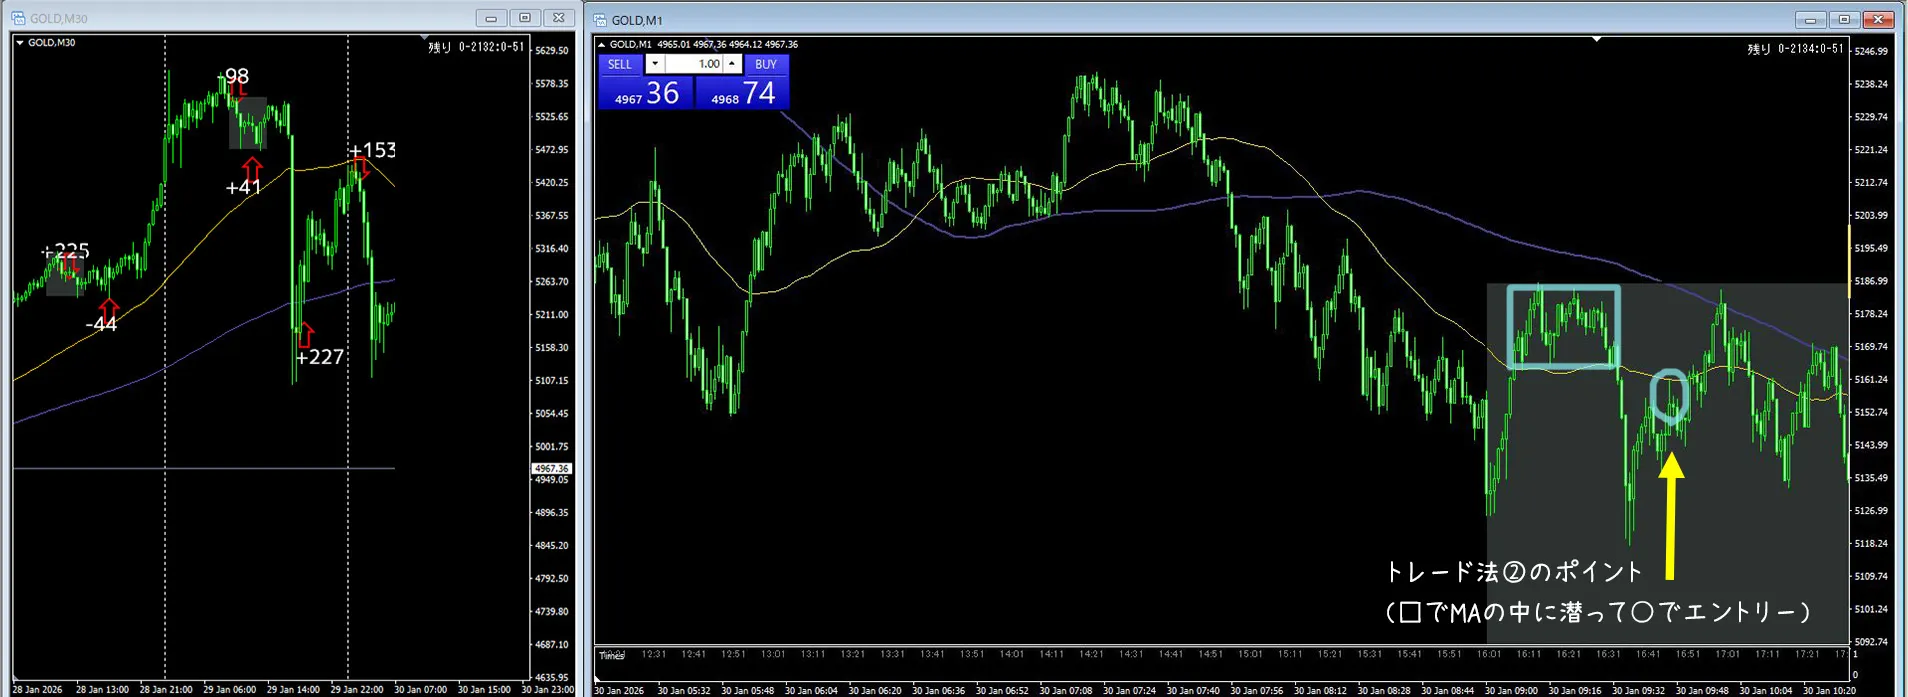
This is the point of Entry Method ②.
Enter when the price dips into MA in the □ area and then at the ○ area you enter.
By watching how price interacts with the MA, you can gauge the timing.
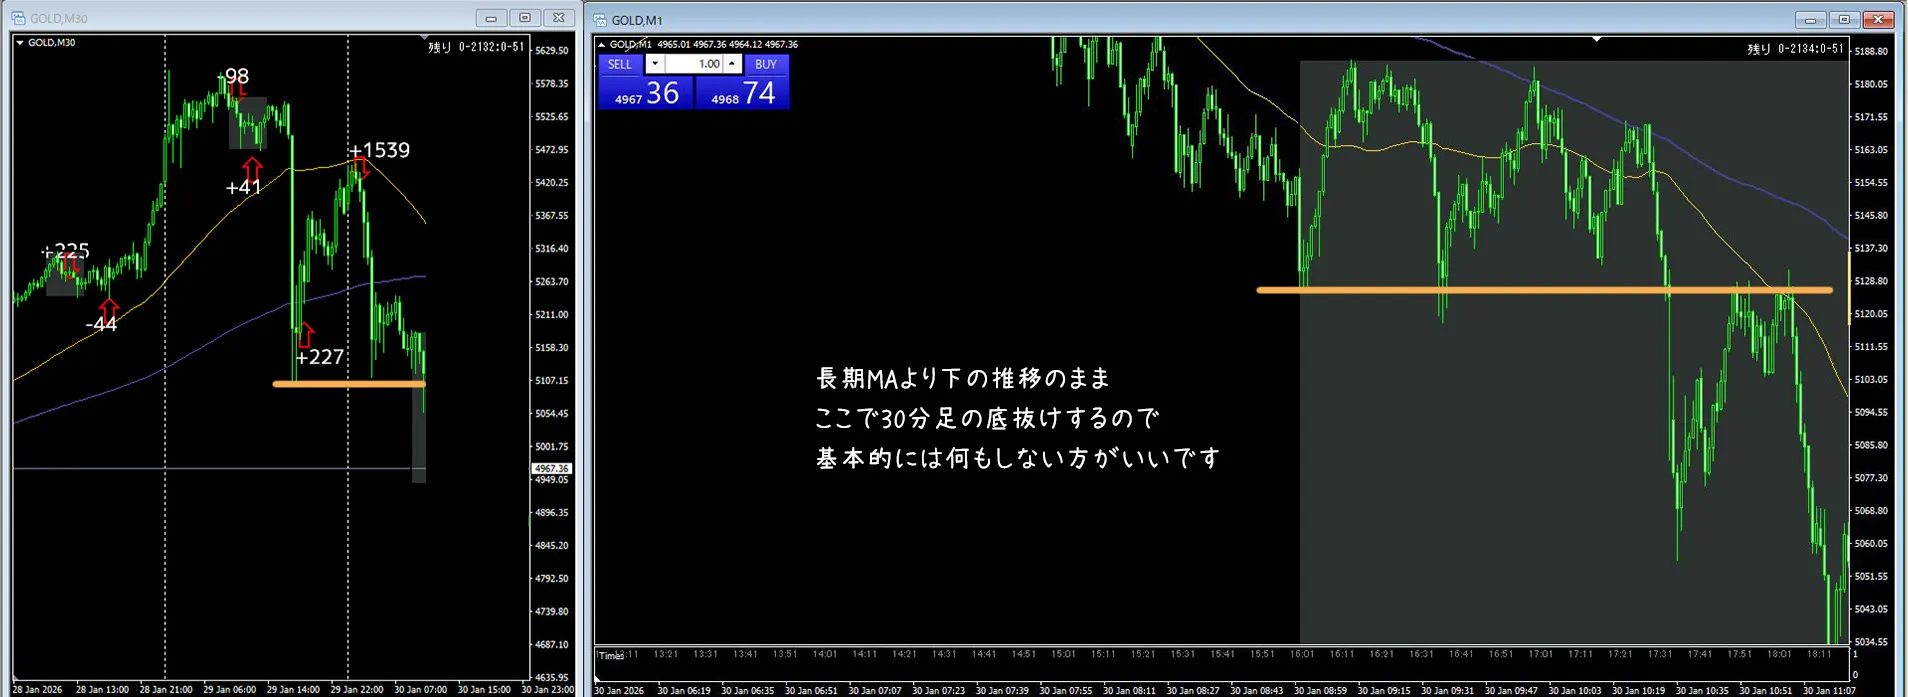
With the price continuing below the longer-term MA, this is where the 30-minute chart breaks below its floor.
In general, it is best not to do anything.
In scenes where the downward momentum is strong and there is no room to wait for a pullback, do not touch it.
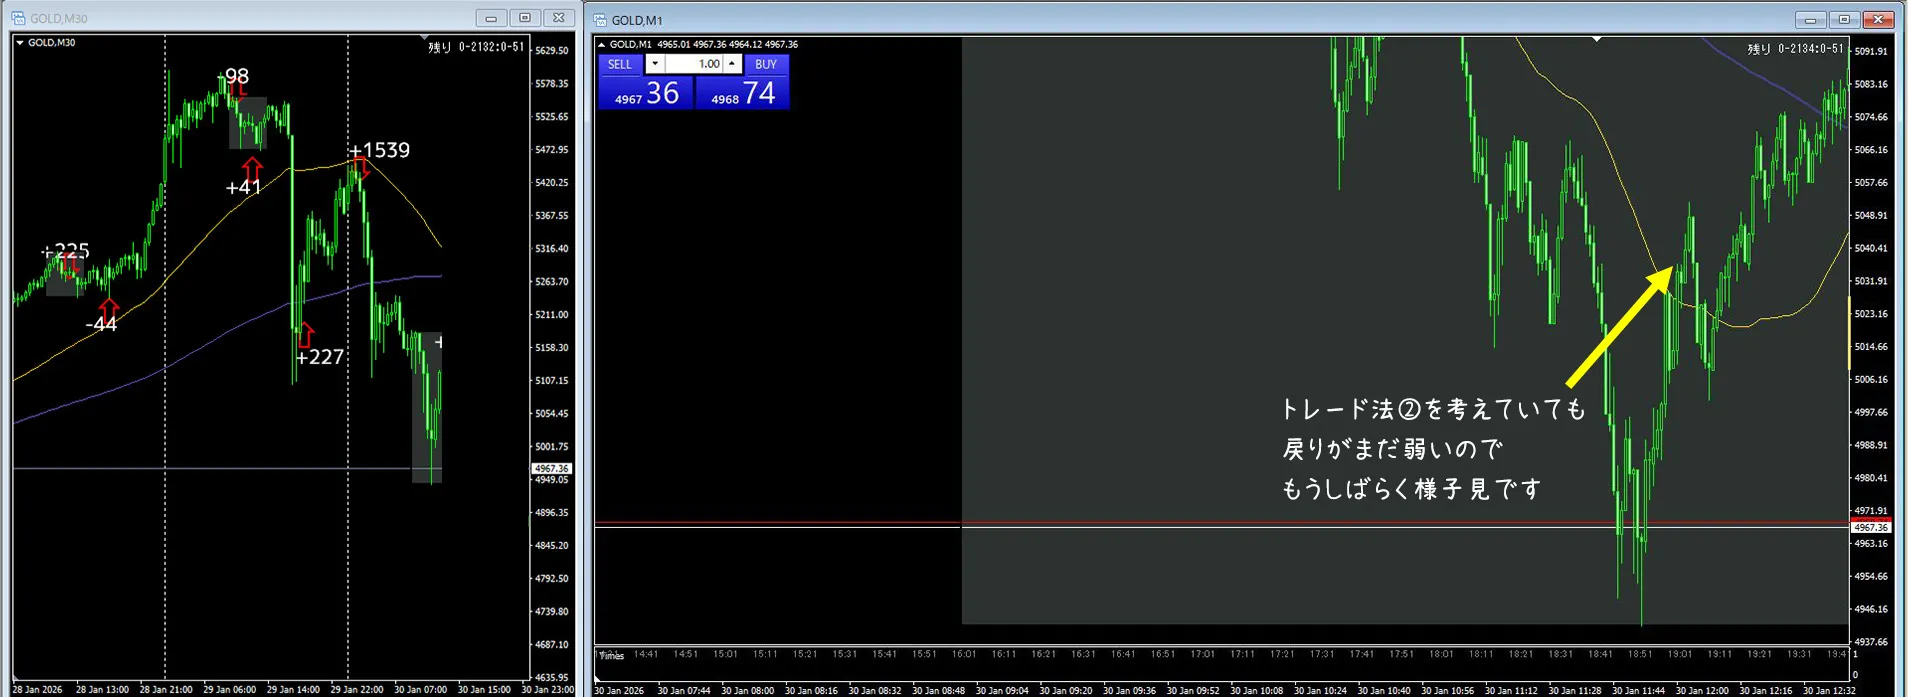
Even if you are considering Method ②, the retrace is still weak, so wait a bit longer.
If you rush in such scenes, you will enter at an incomplete position.
Waiting for a clear retrace is the key.
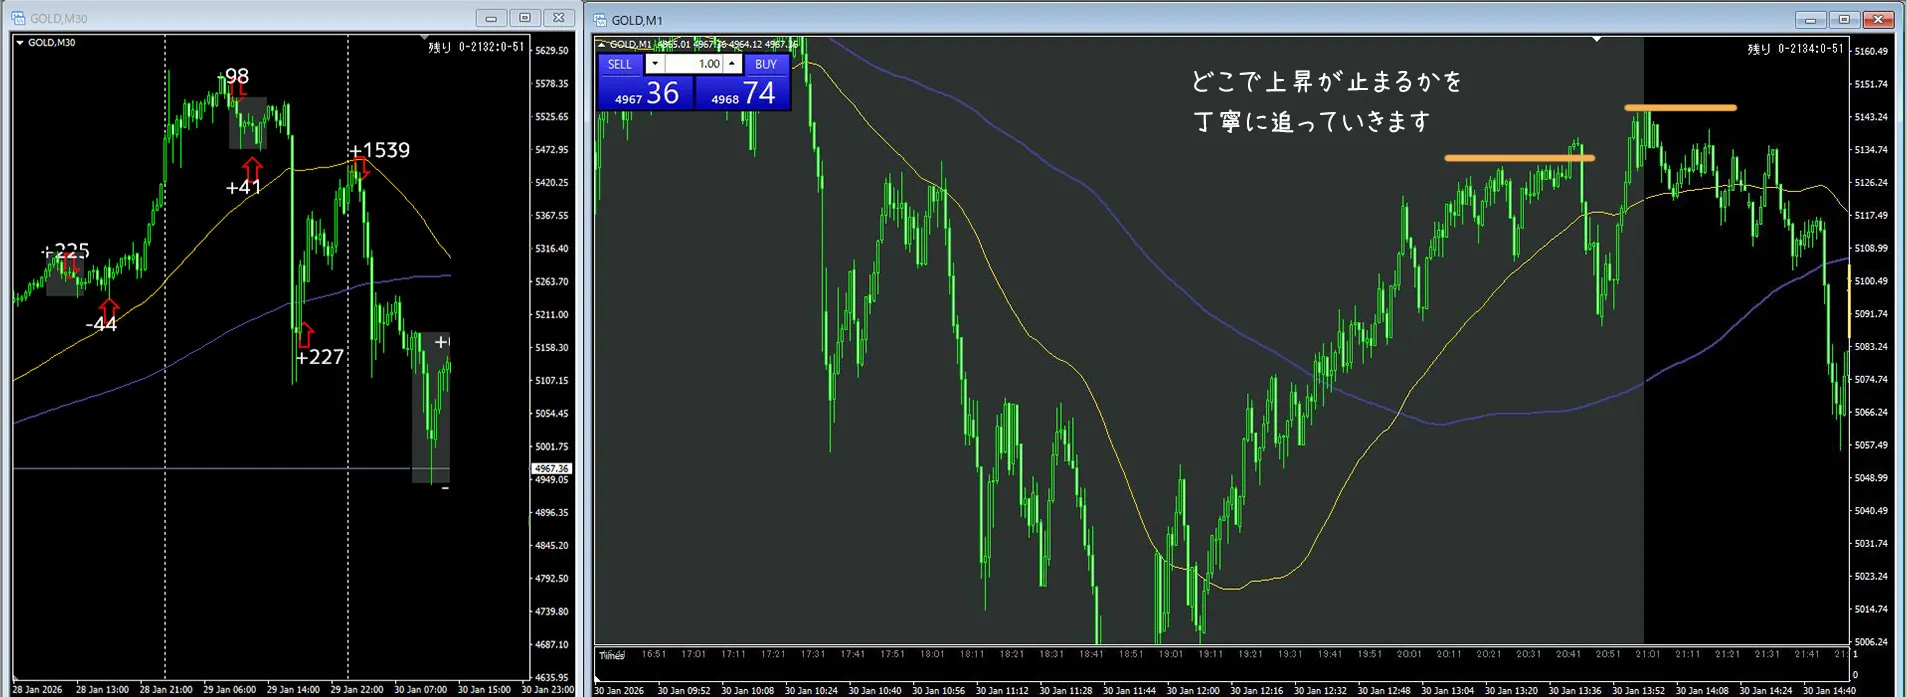
It has risen.
I will carefully track where the rise stops.
The place where it stops becomes the next entry point candidate, so this is a time to observe carefully.
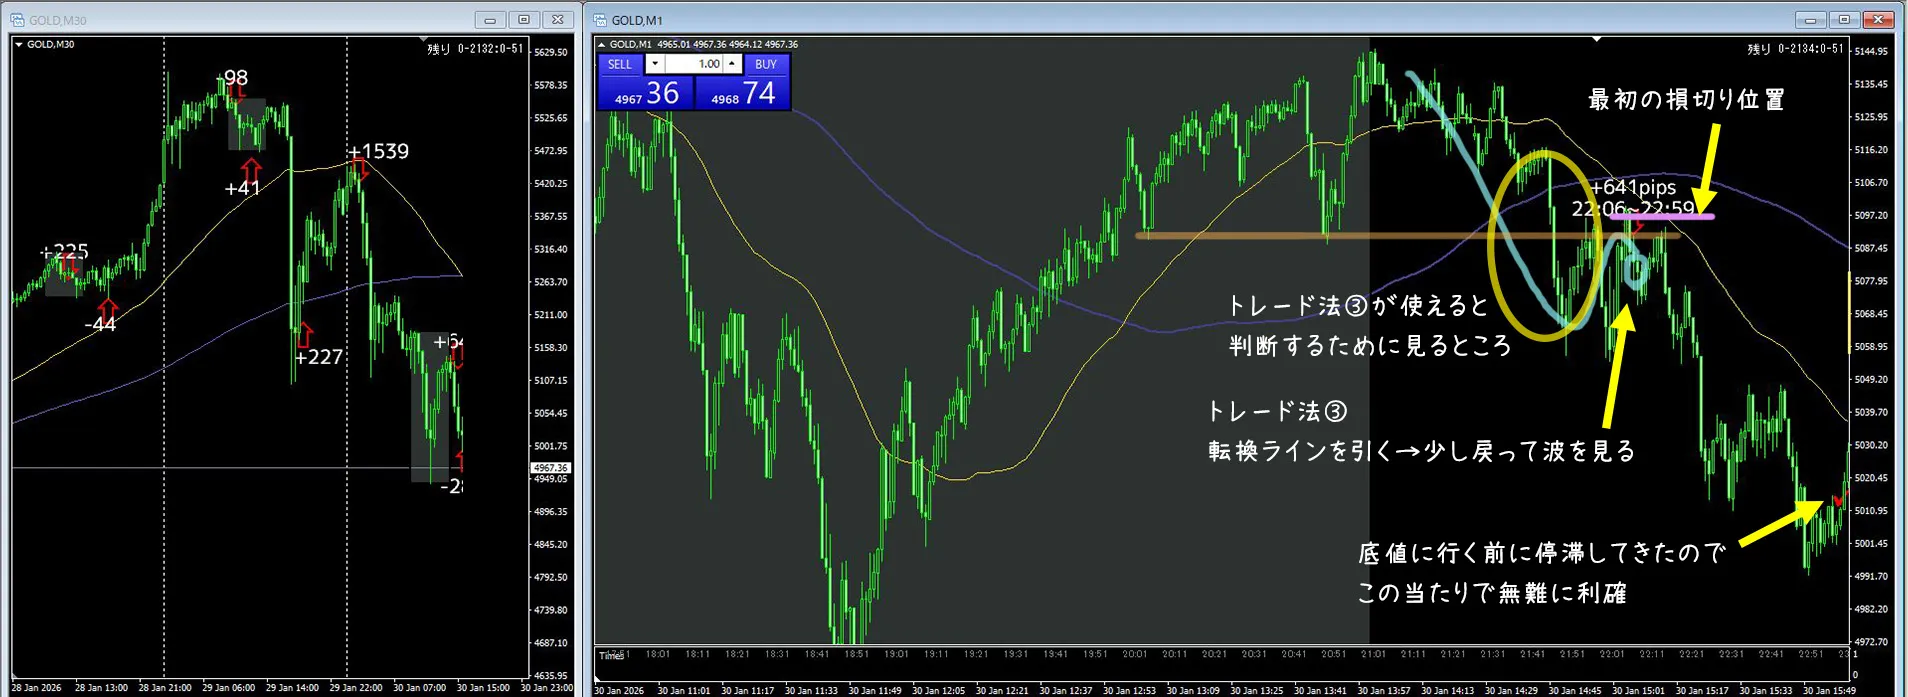
This is the pattern for Entry Method ③.
Draw a turning line and target a slight retrace.
It stagnates before reaching the bottom, so a conservative profit-taking around here is fine.
The usual shape as always^^
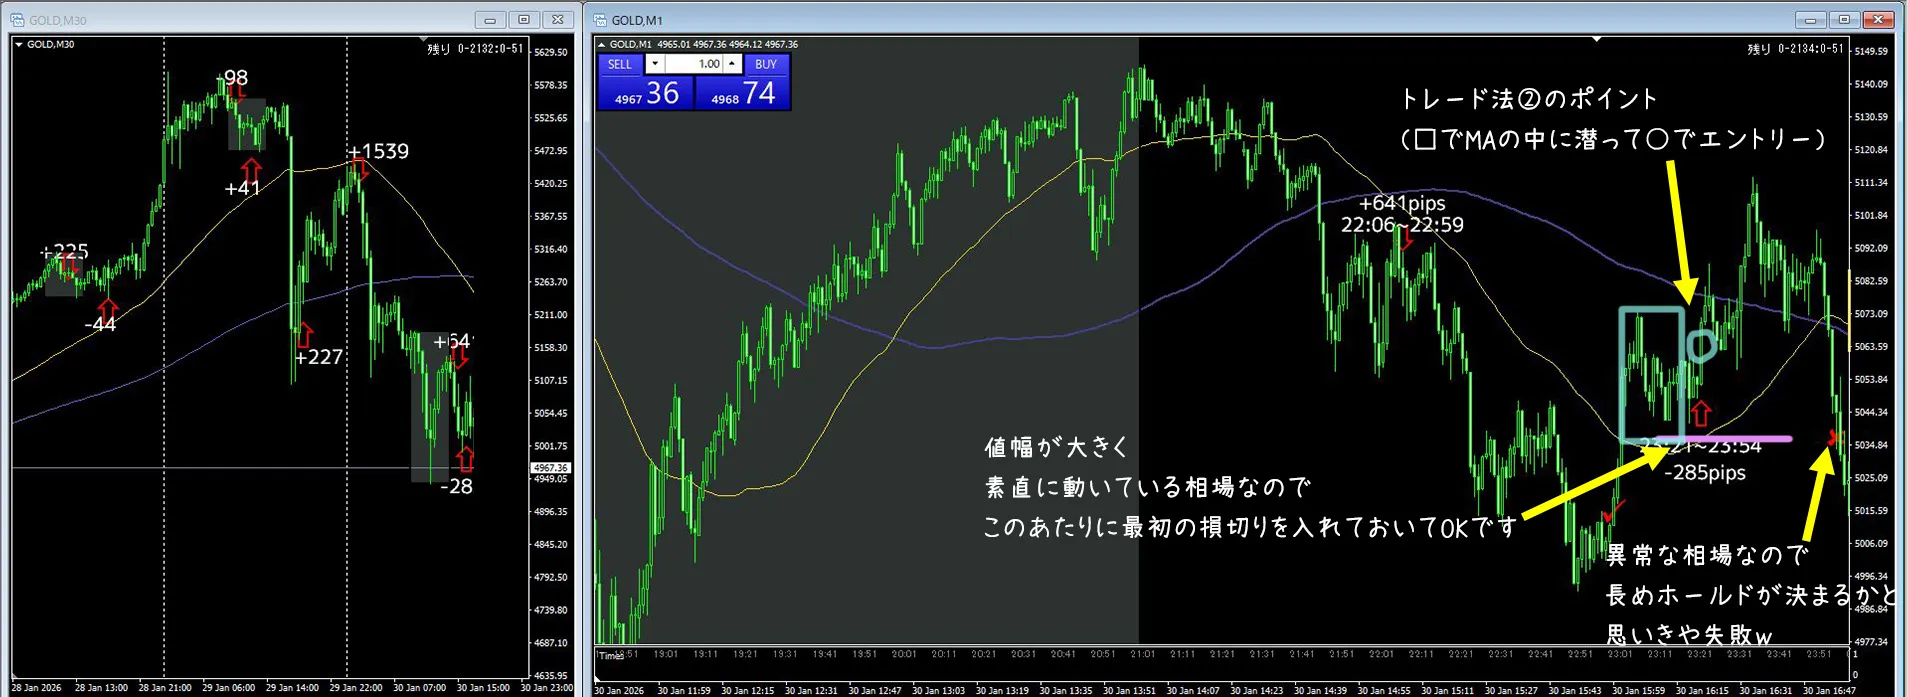
Here is the point of Entry Method ②, enter at ○ after diving into the MA in the □ area.
The market moves with large amplitude and straightforwardly, so placing the first stop-loss around here is okay.
However, given the abnormal market, holding longer seemed promising but failed haha
From the previous +641 pips and the subsequent -285 pips, this is a look at the exit.
If stopped out, move on without worry to the next opportunity.
The pattern was correct, so repeat the same judgment.
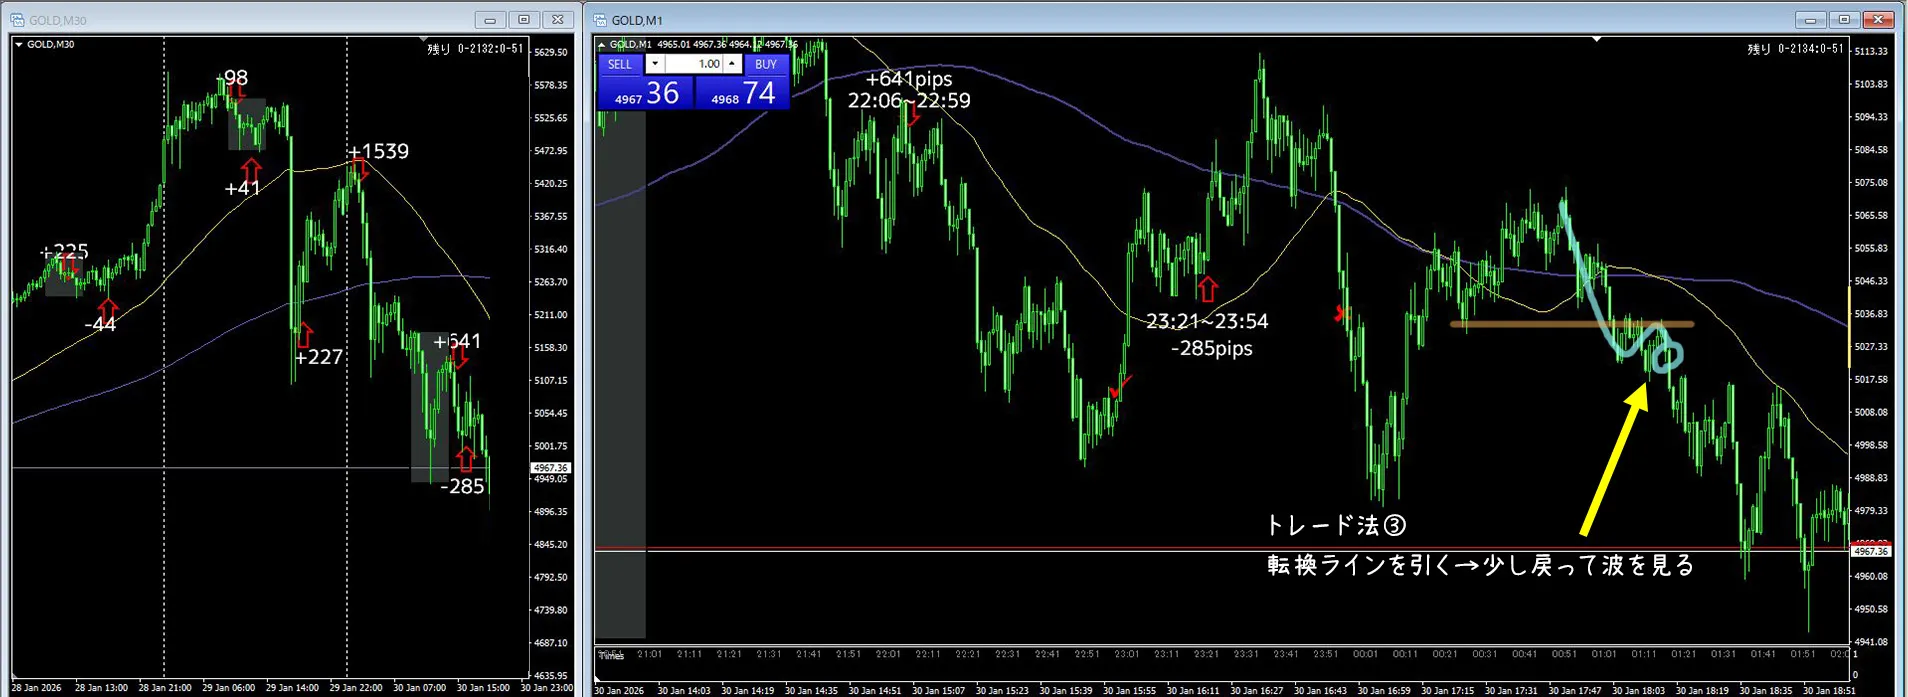
Afterward, it is again the scene of Entry Method ③.
Draw a turning line, a slight retrace, and observe the waves.
The usual procedure.
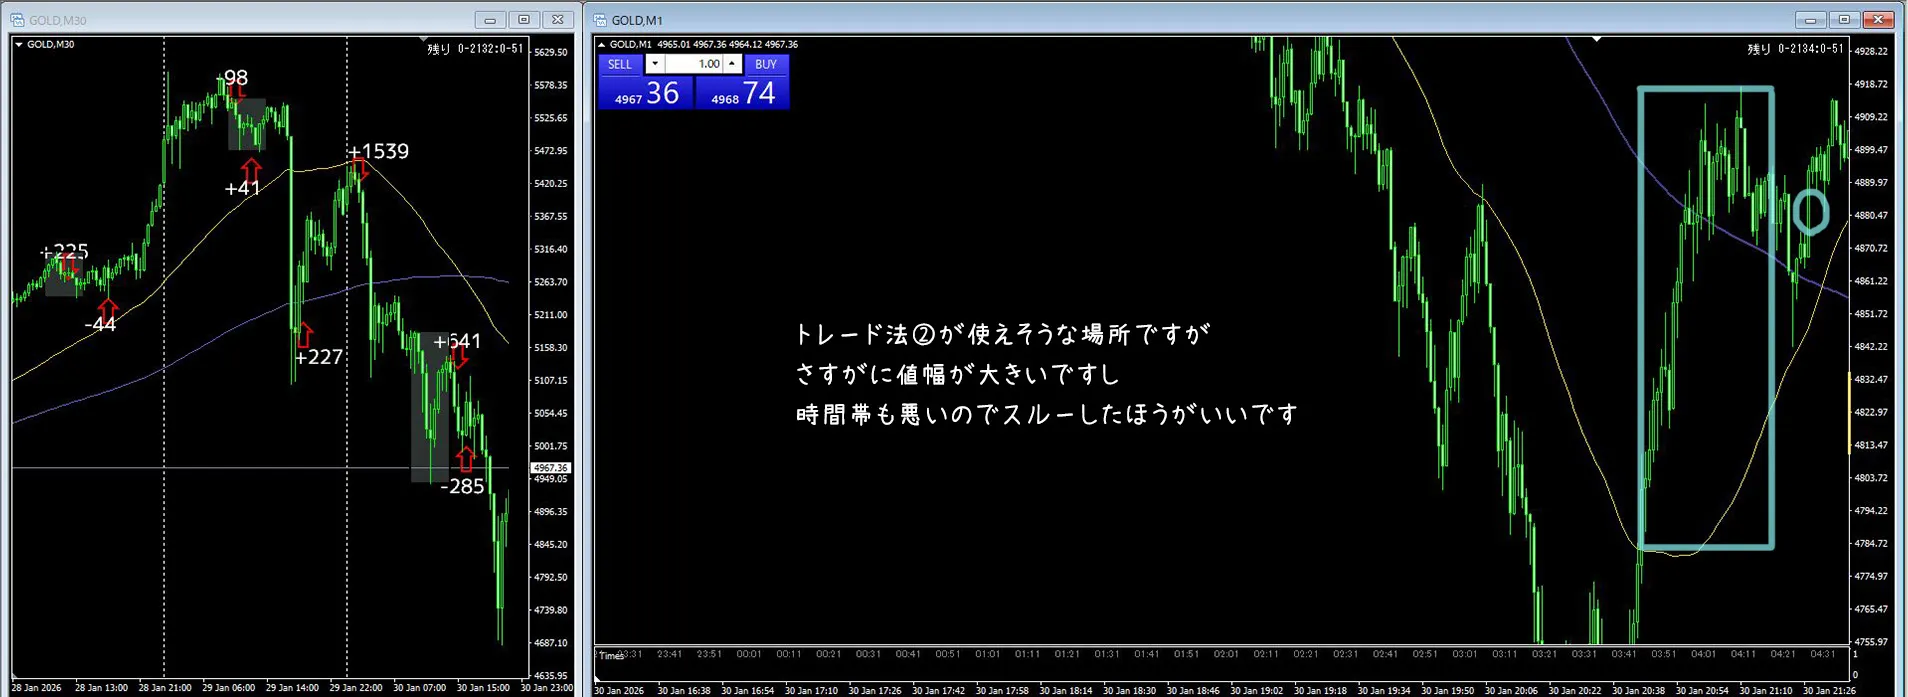
This is a place where Entry Method ② could be used, but the range is large and the timing is poor, so it’s better to skip.
Even with all conditions met, you must consider timing and range to decide to pass.
This is where the gap between those who win and those who don’t becomes clear.
Now, let’s review the 30-minute chart again.
This is the part where I explain why I thought about this, with the 30-minute chart as the focal point.
Illustrating it like this helps with later reviews.
From the recent area, I hope this can serve as a reference for how to view the 30-minute chart^^
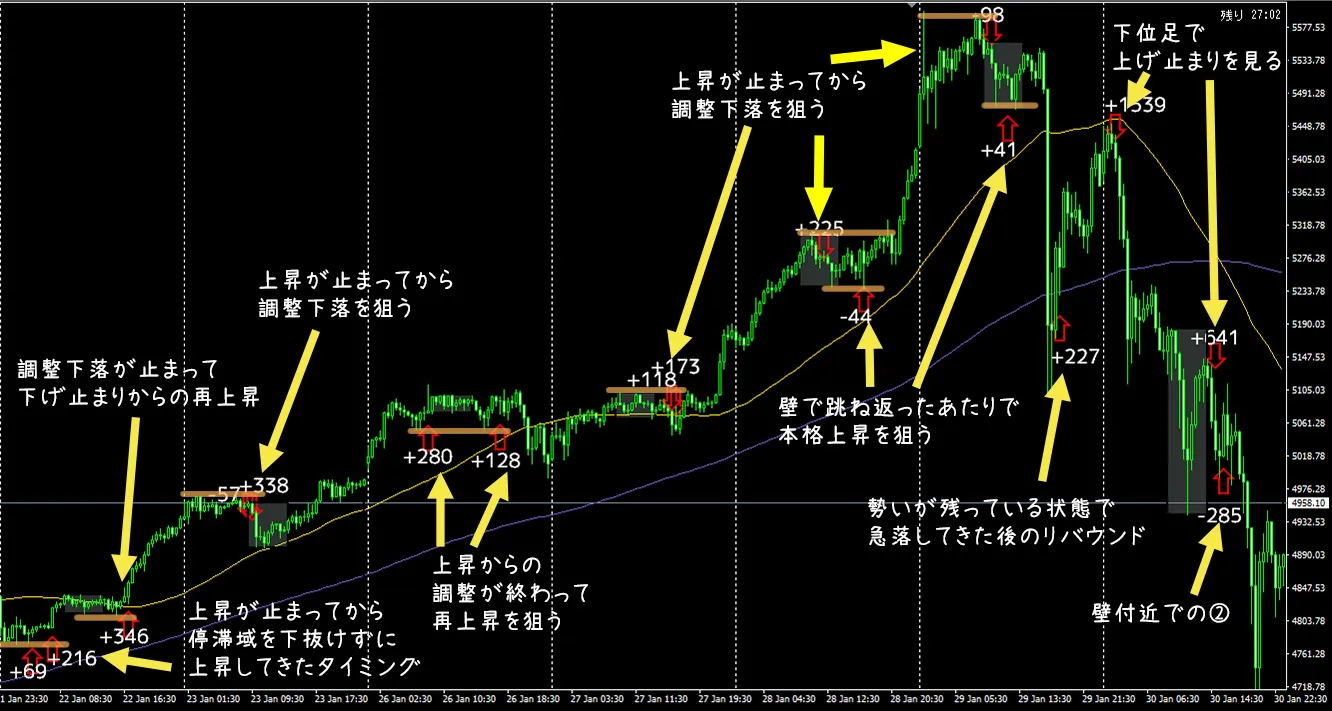
Looking at the 30-minute chart, you can see that trades on the 1-minute chart occur within the 30-minute chart’s flow: targeting pullbacks after an ascent, aiming for a full rise after a bounce off the wall, rebounding after a strong drop while momentum remains, and pattern ② near the wall, etc.
Including scenes where you watch for tops on the lower timeframe, everyone should be aware of the sequence: first the 30-minute chart, then the 1-minute chart.
As mentioned at the start, the goal is for you to be able to create images like those provided in this Investment Navi+ yourself.To be able to create them yourselfTherefore I hope you continue reading. The key is to get used to it. If you stop reading and search for another method, you’ll have to start from scratch again.Starting from scratchAgain, you see.
--------------------------------------------
↓ Join the community here
https://www.gogojungle.co.jp/tools/ebooks/50406
--------------------------------------------
If you feel discouraged partway, reread the manual’s bonuses. Winning people are increasing. If you don’t have it yet, please grab it now^^
If anything is unclear, feel free to contact me anytime!
Now, please look forward to the next edition!
◆━━━━━━━━━━━━━━━━━━━━◆
↓ GOLD Cure here
https://www.gogojungle.co.jp/tools/ebooks/50406

-------------------------------
↓ Scalping here
https://www.gogojungle.co.jp/tools/ebooks/50868

If you’re building seed money, scalping is the best option. If you purchase scalping, feel free to email me with any questions about the manual contents—I will respond without limit^^
◆━━━━━━━━━━━━━━━━━━━━◆
.。.:*・゜+.。.:*・゜+.。.:*・゜+.。.:*・゜+.。.:*・゜+
【Free gift】 A portion of the manual is 공개
https://www.gogojungle.co.jp/info/22533
↑Get it now while you can
.。.:*・゜+.。.:*・゜+.。.:*・゜+.。.:*・゜+.。.:*・゜+
~お願い事項 regarding subscription~ ◆As information is a product, refunds are not accepted. ◆We do not provide investment advice; please understand. ◆Final trading decisions should be made by you. ◆We may refuse those with poor purchase history or bad manners. ◆Total profits including losses are managed by you, so adjust lot sizes at your own discretion. ◆All content is the intellectual property of the publisher. ◆Resale, plagiarism, or redistribution on the internet is strictly prohibited. Violators will have their IP addresses disclosed, identified, and, after consultation with our counsel, legal action will be taken.


