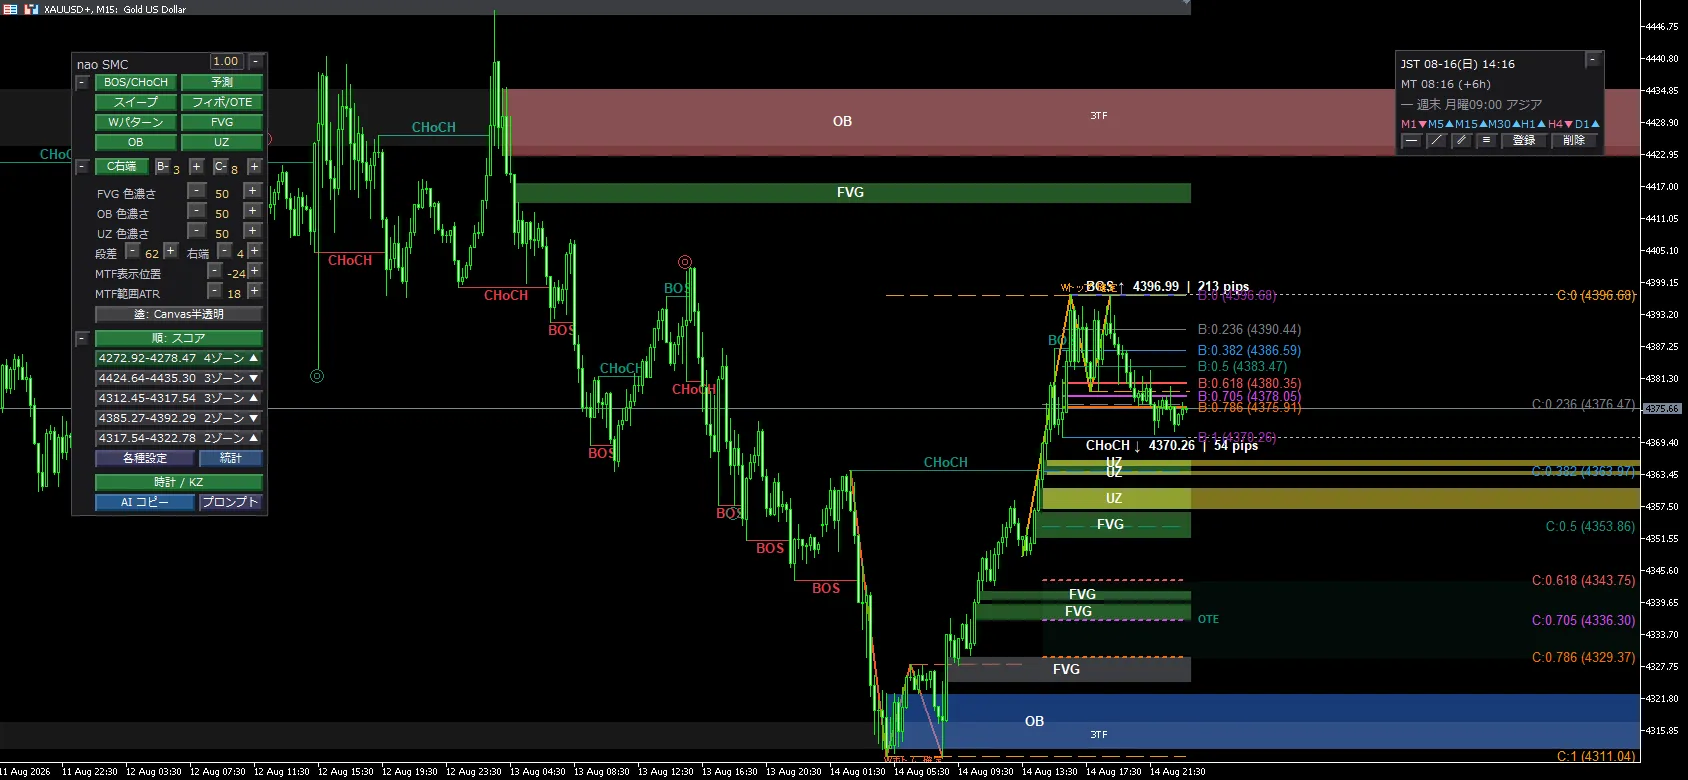
Vol. 7 “Where” and “When” Align to Allow Entry — Integration of Top-Down Analysis and Kill Zone 【SMC Practice ①】
Hello, this is nao.
From Vol.1 to Vol.6, we have stacked one weapon of SMC after another. Market structure, BOS/CHoCH, liquidity, order blocks, FVG, Premium Discount +0.705 — they are all in place, aren’t they?
This time, I will hand you a map of how to combine and use those weapons.
However, I must tell you one honest thing here.Learning only “where to enter” is not enough.Only when you add “when to enter” does the logic become complete.
How to maximize the weapons learned from Vol.1 to Vol.6 — the integration of top-down analysis and kill zones.
Key terms used in this article
The abbreviations below appear frequently in this article. If you’re seeing them for the first time, it’s smooth to check them first.
・SL (Stop Loss): A stop-loss order. An order that is automatically settled when the position reaches a certain loss.
・BSL (Buyside Liquidity・Buy-side Liquidity): The aggregate of “short SL (buy-back orders)” and “breakout buy orders” piled near the highs. When price reaches here, those buy orders are executed all at once.
・SSL (Sellside Liquidity・Sell-side Liquidity): The aggregate of “long SL (sell-off orders)” and “breakout sell orders” piled near the lows. When price reaches here, those sell orders are executed all at once.
・DOL (Draw on Liquidity): The liquidity location where price is drawn next. The market’s “next destination.”
・BOS (Break of Structure): Structural breakdown that intrudes into the most recent swing low/high with a real body. A sign of trend continuation.
・CHoCH (Change of Character): A sign that the previous direction collapses and reverses.
Top-down analysis: stacking weapons from higher timeframes
Top-down analysis means,analyzing from higher timeframes to lower ones in order.
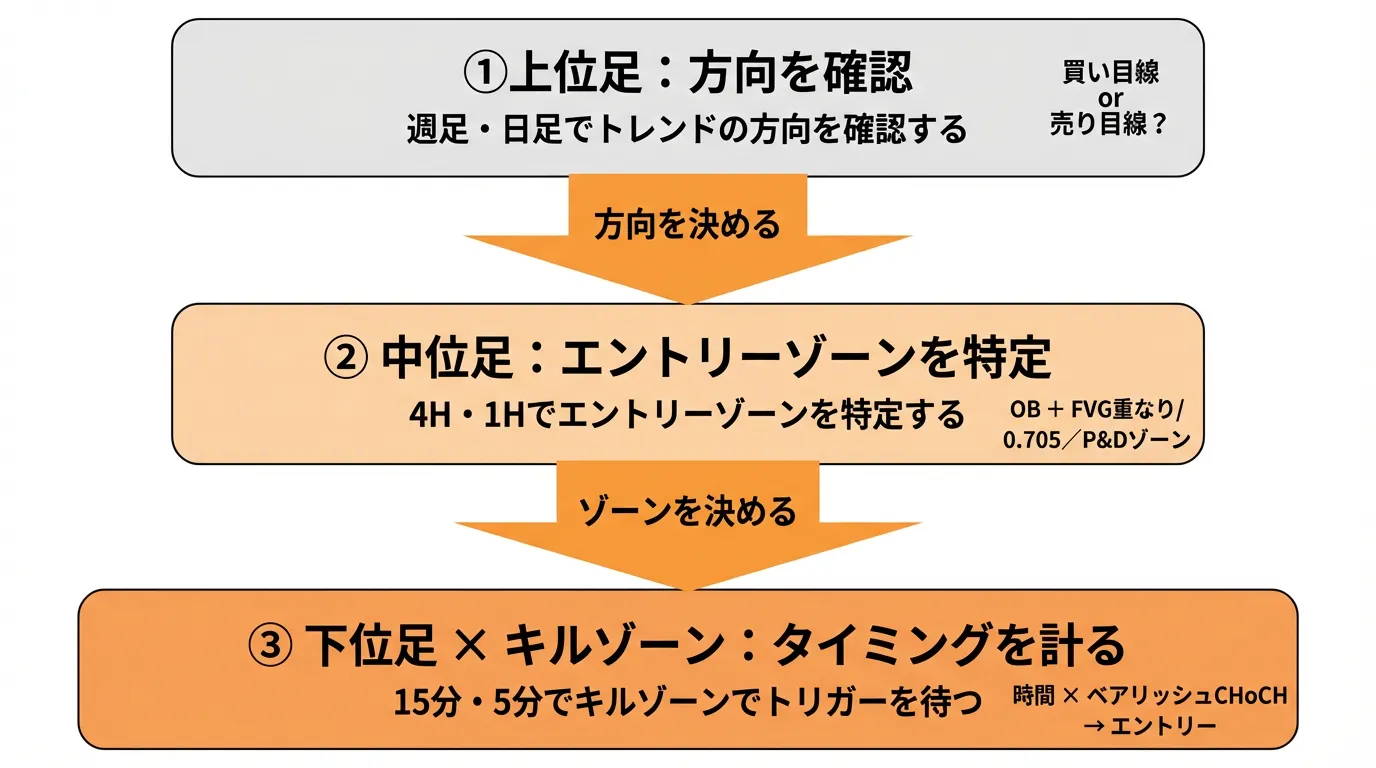
The three-step flow is: confirm the trend on the larger timeframe (weekly/daily), identify entry zones on the mid timeframes (4H/1H), and time entries on the lower timeframes (15m/5m).
Why look from the top down? The reason is simple:the higher-timeframe trends reflect the real intent of big players more accurately. If you only look at a 1-hour chart and think “an up-pattern,” but the daily timeframe is in a downtrend, you would be simply chasing a rebound in a retracement.
Follow the higher-timeframe flow, and build your entry rationale on the lower timeframes.That’s the essence.
So far we’ve talked about direction and location. Next comes the discussion of time.
Kill zones — when time is added, the market changes
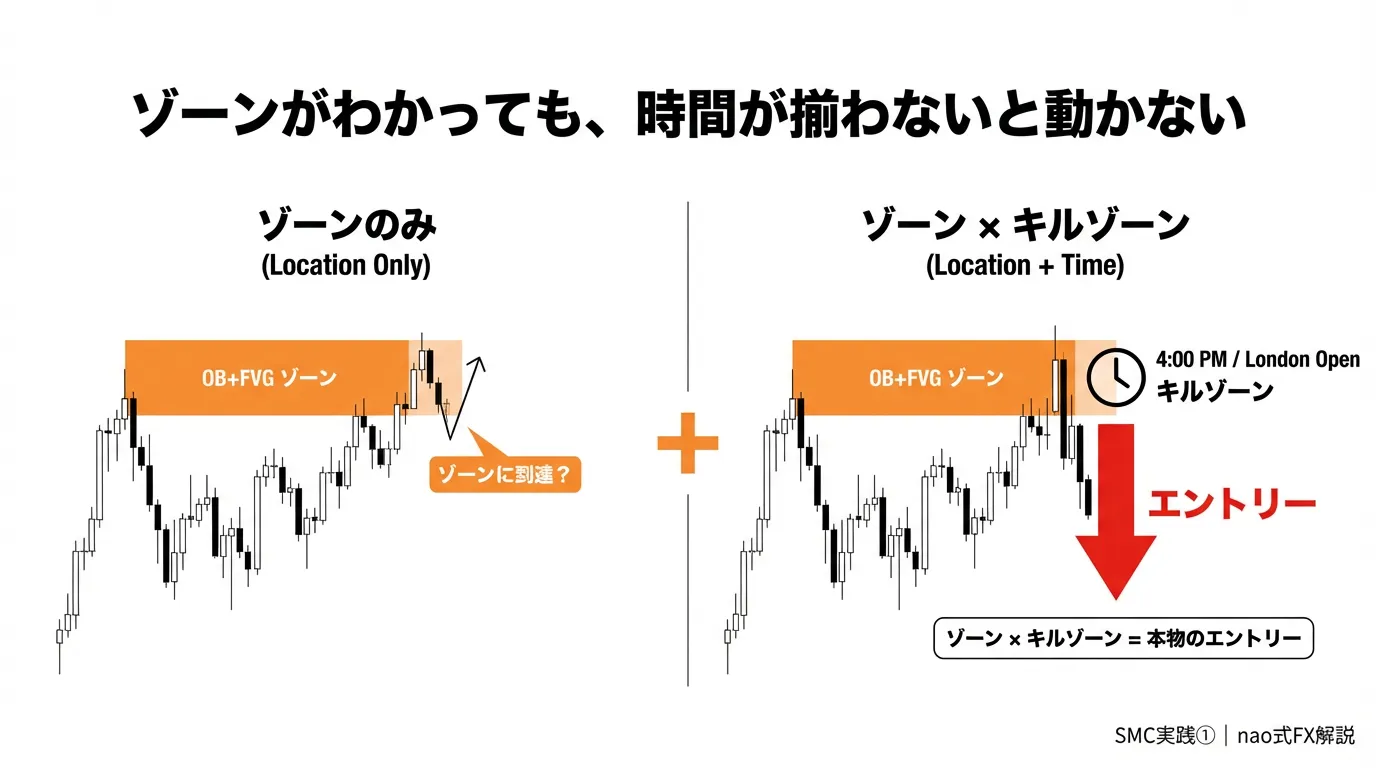
Even when you can identify a zone, have you experienced price breaking through instead of stopping there, or starting to move somewhere else before reaching the zone? The cause is often,the entry timing being out of sync with the time when institutions actually move.
The Kill Zone, proposed by ICT, is the specific time window when institutions aggressively place orders. The FX market operates 24 hours, but the zones with meaningful movement occur only during a few overlapping sessions.
Main Kill Zones (in Japan time)
・Asia Kill Zone(Summer 9:00–13:00 JST / Winter 10:00–14:00)
Centered on the Tokyo session. It used to be relatively quiet, but GOLD behavior has changed in recent years. With a large influx of Chinese retail investors, continual gold purchases by the People’s Bank of China, and the Shanghai Gold Exchange (SGE) activity, price moves have at times matched London/NY. Judas Swing patterns are peculiar to London KZ, but Asia time also now features its own liquidity dynamics that can’t be ignored. Also, there can be moves driven by Sydney participants before Tokyo during thin liquidity. Because liquidity is thin, many moves are sweeps rather than real breaks, and prices often revert once Tokyo time begins. Knowing this helps avoid panicked entries during sharp moves before Tokyo time.
・London Kill Zone(Summer 15:00–18:00 JST / Winter 16:00–19:00)
The most important time of the day. London participants enter, sweep the range high/low accumulated during Asia, and then move in the direction of the real trend.
・New York Kill Zone(Summer 20:00–23:00 JST / Winter 21:00–翌0:00)
The second major move driven by the NY participants. It can continue or accelerate London’s momentum, or momentarily negate it and reverse toward the main direction. This is a particularly important time for GOLD.
Asia Arrange → Sweep → Real Direction — a three-act market structure
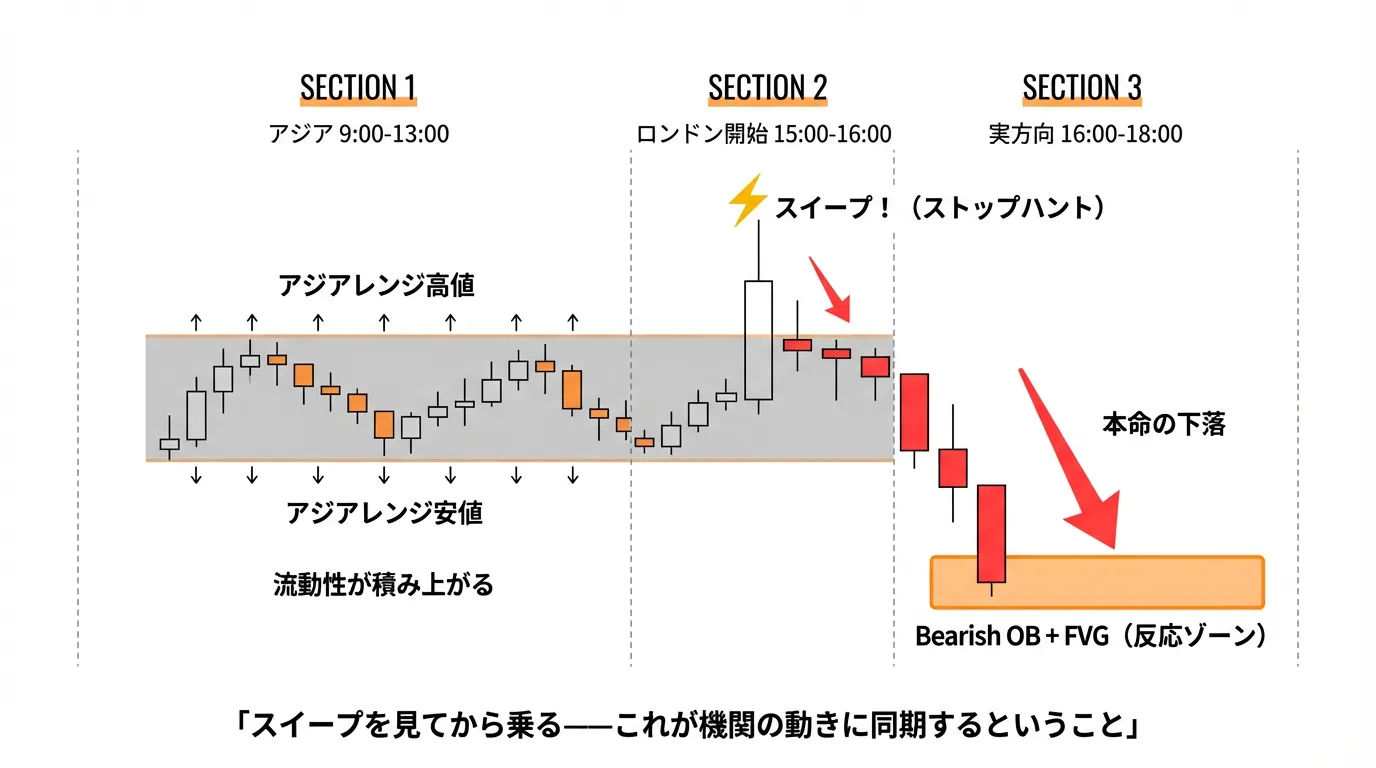
Understanding Kill Zones reveals that a day’s market moves in a “three-act structure.”
Act 1: Asia (10:00–15:00 JST) — Range Formation (Accumulation)
Big players stay mostly on the sidelines. A small range forms, drawing in retail traders’ stops at the highs and lows. The liquidity pool, as explained in Vol.3, is created here.
Act 2: London Start (Summer 15:00–16:00 / Winter 16:00–17:00 JST) — Sweep (Manipulation)
What London players typically do first is to briefly “sweep” the Asia-range high or low. This is the Stop Hunt described in Vol.3. They pounce on the retail positions that leapt in, using that liquidity to build their core positions.
Act 3: Real Direction Movement (Summer 16:00–18:00 / Winter 17:00–19:00 JST) — Distribution
After the sweep ends, price moves in the real direction. The OBs learned in Vol.5 and FVGs serve as reaction zones here.
+NY (Summer 20:00–23:00 / Winter 21:00–翌0:00 JST) — Second Round
London’s directional move is often pushed further by NY participants. There are many cases where price aims at targets in lower SSLs or higher BSLs that London could not reach. Be aware of the pattern where the move accelerates again after a reverse sweep that negates London's move.
Judas Swing and Draw on Liquidity — The “trap blueprint” institutions deploy
In the second act of the three-act structure, the move to briefly break Asia-range highs/lows right after London KZ begins — this has a name.Judas Swing.
“Judas” comes from Judas Iscariot who betrayed Christ. It looks like price will go higher, then suddenly drops. It traps those who chased the breakout and bought, perfectly fitting the name.
So why do institutions need to sweep in the opposite direction first—here comesDraw on Liquidity (DOL)
DOL is the location of liquidity toward which price is drawn next. Price is always drawn toward something. That “something” is the liquidity pool — the cluster of buy orders and sell orders (and their stops) near Asia-range highs and lows.
The important point is that the DOL direction tends to be opposite to the actual direction.
Here’s the key:The direction of DOL is decided by the higher-timeframe trend. When 4H and daily are bearish, the DOL price target is not the lower end of the current range, but a much larger liquidity pool lower down (SSL). Price does not head there in one straight line—it first sweeps the upper BSL before heading to the intended destination of the SSL.
Judas Swing itself is a temporary sweep. Institutions collect BSL on the upside, accumulate shorts, then reverse. After sweeping and collecting BSL, DOL shifts to the SSL below, and price declines. If the 4H/daily are bullish, the lower SSL is swept (Judas Swing) and then DOL shifts to the upper BSL and rises.
So how to read this on actual charts. First,confirm the direction (DOL orientation) on the higher timeframe, then keep in mind that the opposite side’s liquidity zone (BSL/SSL) may be targeted. When price nears that zone, if there’s a price spike followed by a quick return (a wick), you should start suspecting a sweep. If confirmed, the liquidity pool in the higher timeframe becomes the next DOL.
Note that this pattern works best under certain conditions.A solid range forms during Asia time. The more the range forms, the more liquidity accumulates at the highs and lows, creating material for a sweep. Furthermore, if FVGs or OBs overlap near the range’s recent highs or lows, it increases the likelihood institutions will reverse in that zone.
Not that “price breaks above and you buy” is enough. Find the crucial zones first and observe price action there. If price breaks and returns with a wick, suspect a sweep.“Upsweep is actually a signal of the next decline”—this reversed interpretation is essential to riding institutions’ moves.
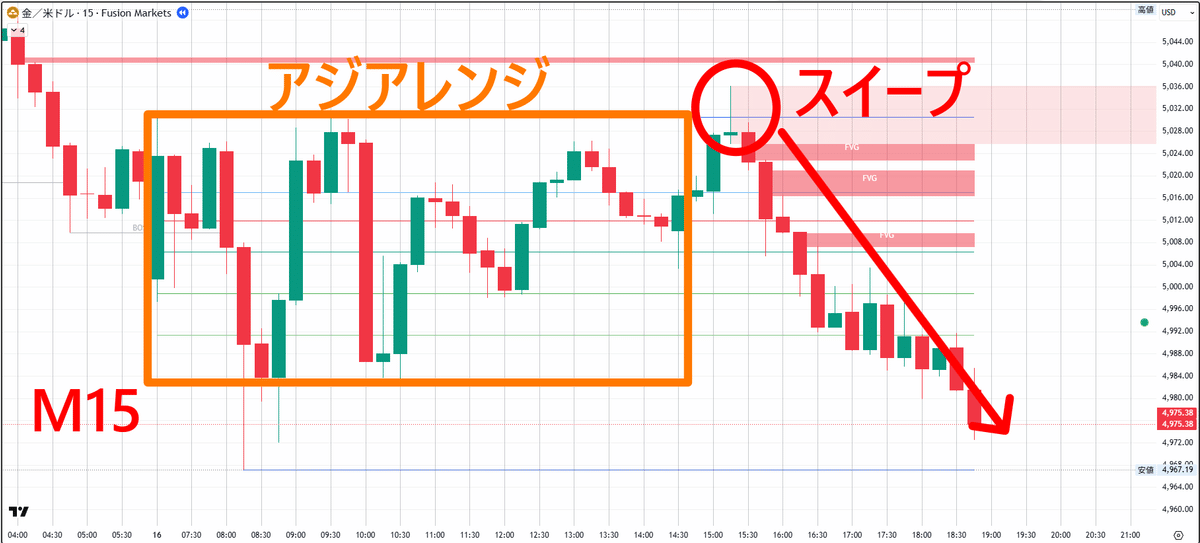
March 16, 2026 real-world example — from BSL sweep to decline
A case on GOLD where the first two acts of the three-act structure were observed on that day.
Premise: 4H/1H/M15 bearish structure established
As a trading premise, this day had a bearish BOS on M15 at 07:00 (the recent low was breached by the real body). Looking at the higher timeframes, 4H had CHoCH confirmed and bearish structure established, and 1H likewise showed CHoCH and BOS. In other words, this day hadall three timeframes (4H, 1H, M15) aligned to bearish. The trade process is always: decide direction on higher-timeframe structure first, then wait for the trigger on the lower timeframe.
Asia time (to around 14:00 JST): accumulation
Price formed an Asia-range around 5,009–5,031. Above this range high (~5,031), there were accumulations ofBSL (buy-side liquidity)—from breakout buying orders and short-stop losses.
London KZ (around 15:15 JST): a brief penetrations of the high and a pullback
At 15:15, price briefly breached the range high and rose to about 5,036, then immediately reversed. This wiped out long positions that chased the breakout and the short SLs. In real time, you’d suspect a sweep from observing that price broke the high and returned by a wick.
Entry trigger: CHoCH on M5
If you can classify that high as a sweep, you can use bearish CHoCH on M1 or M5 (the recent move collapses and updates the lows) as the entry trigger. The flow: confirm direction on higher timeframes (4H/1H/M15) → touch high to suspect sweep → time with M5/M1 CHoCH.
Real direction (until 19:00 JST): gradual decline
Subsequently, price continued downward step by step, breaking EQP around 4,997 and falling to 4,970.
Honest assessment of this case
The high-touch to 5,036 followed by decline was observed. However, it cannot be said to be a complete Judas Swing. It did not reach the SSL (the prior low 4,967.19) as it reversed at 4,970. It was close, and Judas Swing does appear in certain setups—sometimes fully formed, sometimes stopping just a few pips before SSL. The important thing is,set the target SSL as DOL (target) and build the trade around it. Knowing the definition of Judas Swing helps you evaluate both fully formed cases and near-misses accurately, raising the quality of future analysis.
Practice: Integrating the four elements on GOLD
Using GOLD as an example, I’ll consolidate all elements into one flow.
Step 1: Decide the direction (weekly/daily)
As of March 2026, GOLD shows a continuing major uptrend on weekly and daily charts (as long as the most recent daily HL of around 4,270 holds, the up structure remains intact). However, on the 4H chart, CHoCH has been confirmed near the peak around 5,598, and bearish structure continues.
Under this situation you can decide: the daily timeframe is bullish, but the 4H and lower timeframes favor a pullback/sell bias.
Step 2: Identify the entry zone (4H/1H)
Drop to mid timeframes and use all weapons from Vol.4–Vol.6 to narrow the entry zone.
In my view, zone identification guidelines: for swing trades use daily and 4H; for day trading, use 4H and 1H; for scalping, use 1H and M15. If you’re bearish, look for bearish OB in the premium zone (EQP > 0.5); if bullish, look for bullish OB in the discount zone (EQP < 0.5). Overlaps with FVG increase reliability (as explained in Vol.5: OB + FVG overlap zone = highest accuracy area). Also, overlaps with Fibonacci 0.705–0.786 (OTE zone) increase precision.These are additive considerations (the more overlaps, the better), and you don’t need all conditions to be met to enter. OB alone can be enough with a Kill Zone and lower-timeframe CHoCH as evidence.
Step 3: Wait for the Kill Zone
Once the zone is identified, wait for the time. The main battlegrounds are London (Summer 15:00–18:00 / Winter 16:00–19:00 JST) and NY (Summer 20:00–23:00 / Winter 21:00–翌0:00 JST). There are entry opportunities in Asia KZ too, but zones respond more slowly compared with London and NY.
Step 4: Confirm trigger on lower timeframes
Once in the kill zone, monitor the lower timeframes. My guidance is: entry triggers for swing trades are on 4H/1H, for day trades on 1H/M15, and for scalping on M15/M5. The zone is typically two steps up from the time-frame you used for zone identification.
Before price reaches OB/FVG zones, CHoCH/BOS or sweep-like movements can occur. The three most effective entry signals are:Bearish CHoCH (the recent rise collapses and updates the lows),BOSreversal candle in the OB zone(pin bar, engulfing, etc.). Any one, or multiple, aligning signals is a good entry consideration.
“Entering zone does not mean entering the trade.”Zone × Kill Zone timing × lower-timeframe entry signs—the more these align, the stronger the reason to enter.
Nao’s honest view: What changed after adopting Kill Zones
Before focusing on Kill Zones, once I entered, I would stay in the trade and wait, even if price stopped moving, thinking “it will move someday.” When I finally exited, it was often at break-even or marginal loss. This happened repeatedly.
Since I started focusing on Kill Zones, the change isto watch how the time ends. If action slows near the end of a Kill Zone, I take profit or reduce exposure. I decide after watching how price behaves at the Kill Zone entrance. This alone improved win rate and PIPS gained per trade noticeably.
Identifying zones and reading time are distinct skills. The important point is that for Japanese traders, both London (Summer 15–18 / Winter 16–19) and NY (Summer 20–late night / Winter 21–late night) are realistically tradable times. “Evening and night after work” can be an advantage.
Summary: Today's 3 major points
①Use top-down analysis to decide direction → zone → trigger in order.Confirm trend on weekly/daily, narrow entry zones using OB + FVG overlap + 0.705 + Premium Zone on 4H/1H, and wait for CHoCH on lower timeframes. Use weapons Vol.4–Vol.6 here.
②Kill Zone decides when to enter.London (Summer 15:00–18:00 / Winter 16:00–19:00 JST) and NY (Summer 20:00–23:00 / Winter 21:00–翌0:00 JST) are the main battlegrounds. Asia KZ offers opportunities, but London and NY take priority.
③Sweep patterns are Judas Swing — look when price moves in the opposite direction.The counter-move that starts at London KZ is Judas Swing. The price sweeps upward to collect BSL, institutions build shorts, and DOL shifts to SSL for the real direction downward. However, Judas Swing is considered complete only when price breaks the opposite SSL with a real body after the sweep. Do not enter on a sweep alone; wait for BOS/CHoCH confirmation to improve reliability.
Next timeScenario-building in practice—Using this framework, I will demonstrate how to construct a scenario the day before and on the day of a trade.
─────────────────────
nao|FX full-time trader and EA developer
I started promoting SMC after discovering that my personally learned winning patterns were being called “SMC.”
Specialized in GOLD scalping and day trading. Sells the EA “tundere series” on GoGoJungle,
and developed the SMC visualization indicator “nao_smc_mt5” that maps the same decision criteria onto charts.
From structure, zones, 0.705, to the next break forecast — right on the chart at the moment it opens.