2026/3/14 Dollar/yen, gold, SP500, and Nikkei 225 environment

The indicator in the attached image uses the above indicators.
Break Edge 9 is recommended. It is continually evolving.
For verification purposes, we prepare weekly videos of the USDJPY price action.
USDJPY
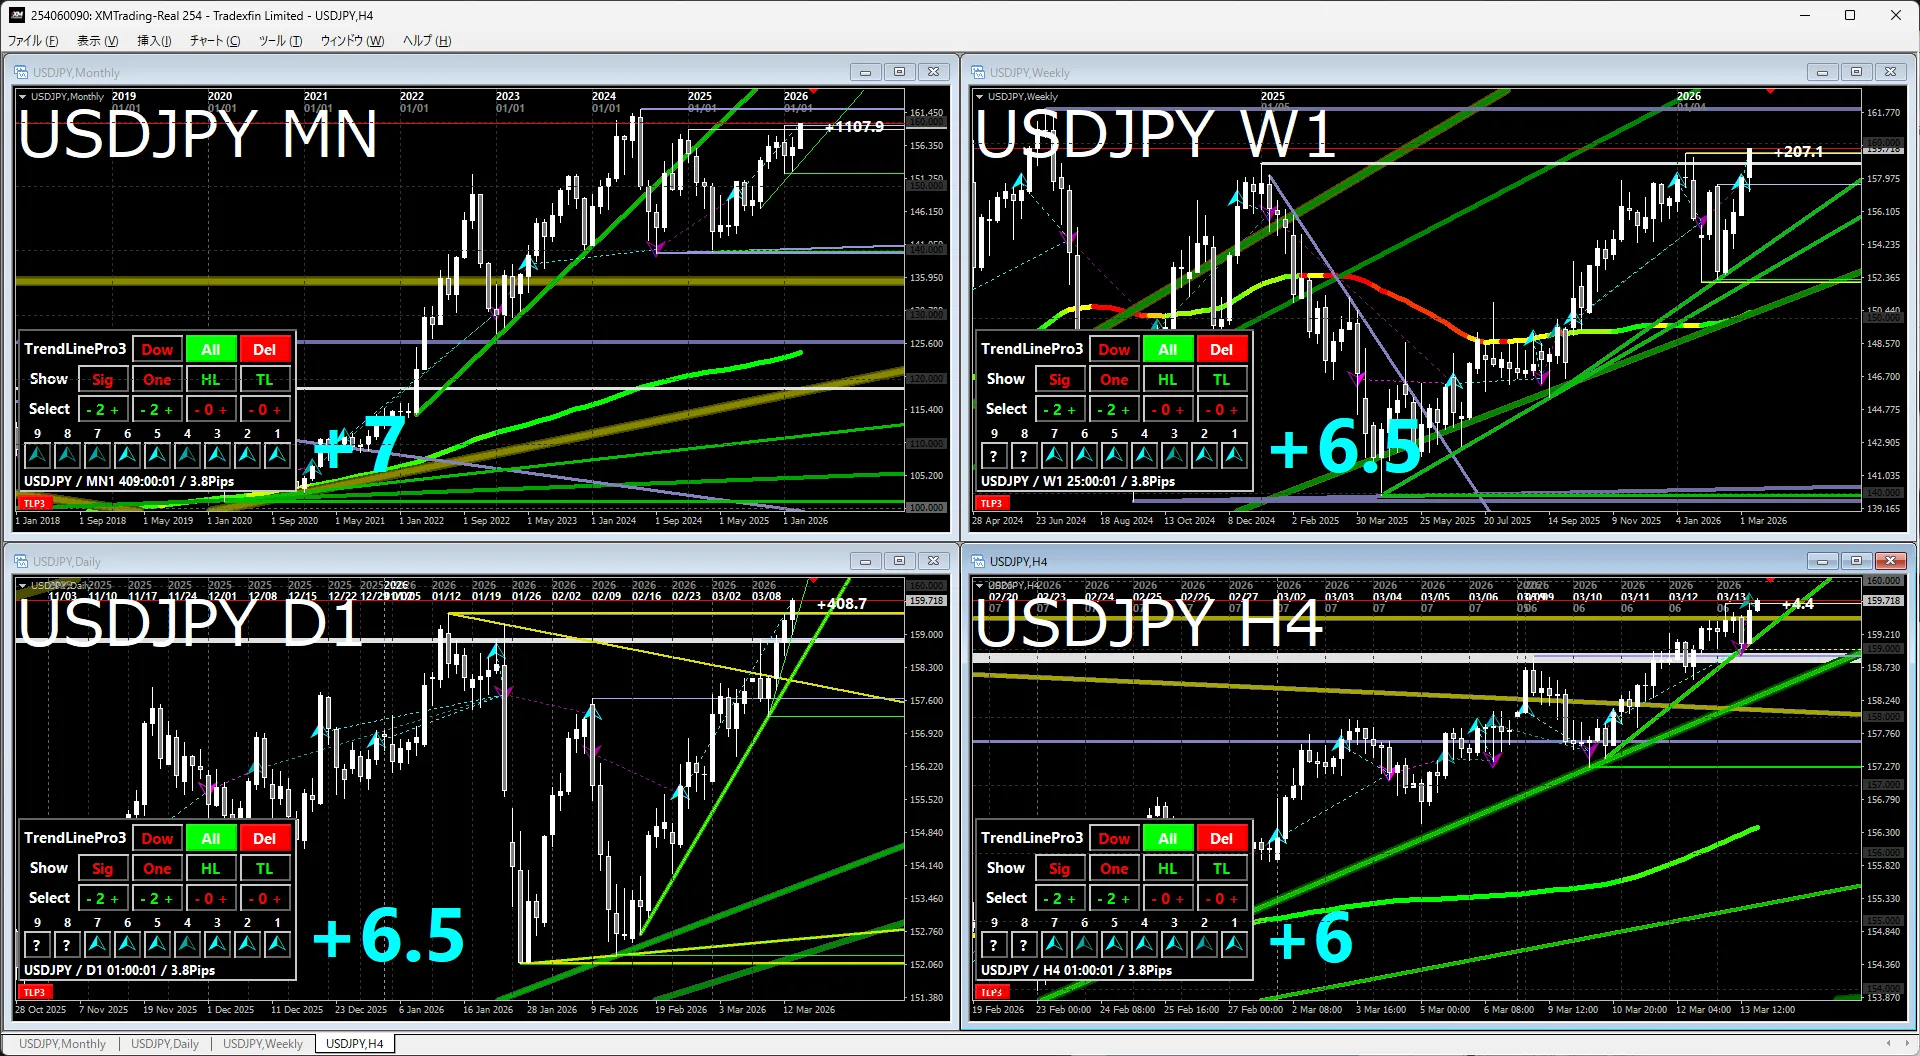
Monthly & WeeklyThe recent sideway consolidation clearly showed a continued rise. Next, it seems to test the monthly high.
Daily & 4-hourIt has broken out of the white horizontal line indicating consolidation. A pullback is possible, but the upside remains in focus.
Gold
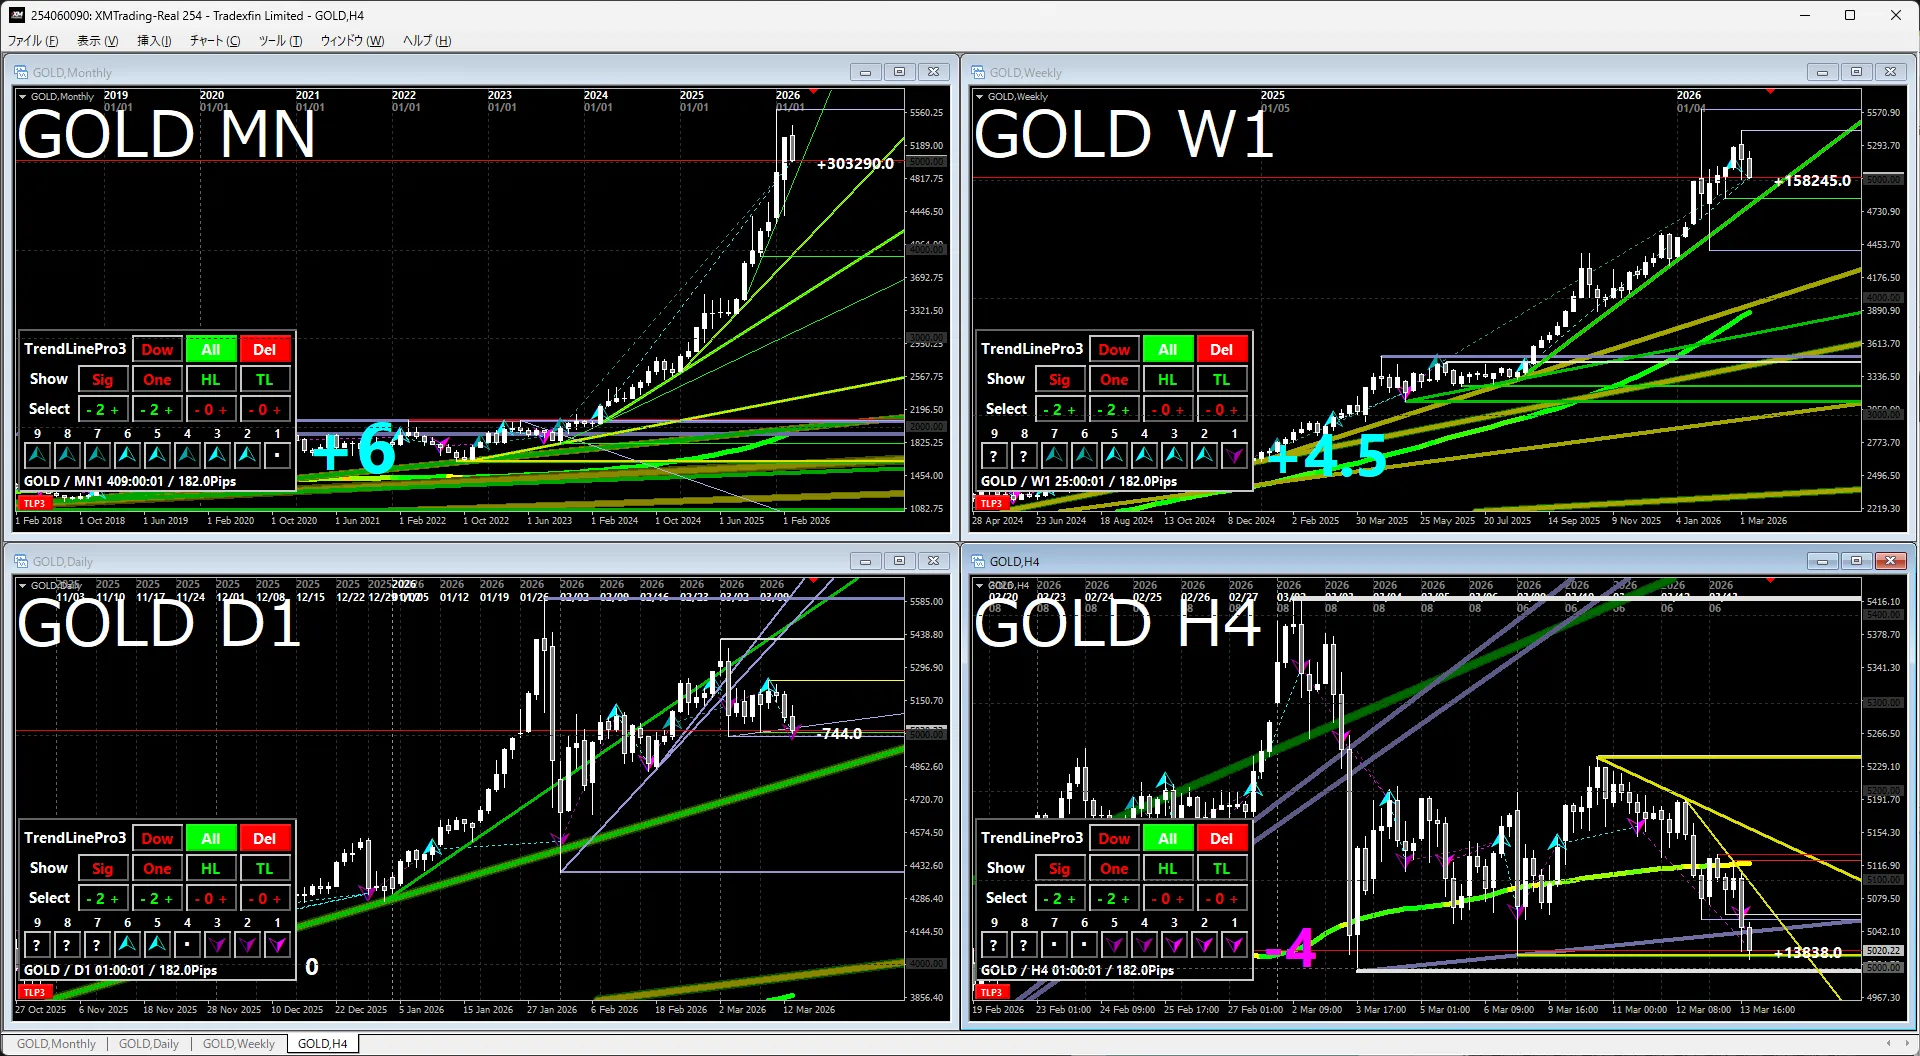
Attention is on the decline in currency value, and Gold remains a preferred buy stance.
However, based on the chart pattern, it is in a state where it is unable to set new highs and is testing recent lows.
This shape tends to turn to a downside-testing move, and depending on Monday’s price action, it may test an elegant upward-sloping trendline.
S&P 500
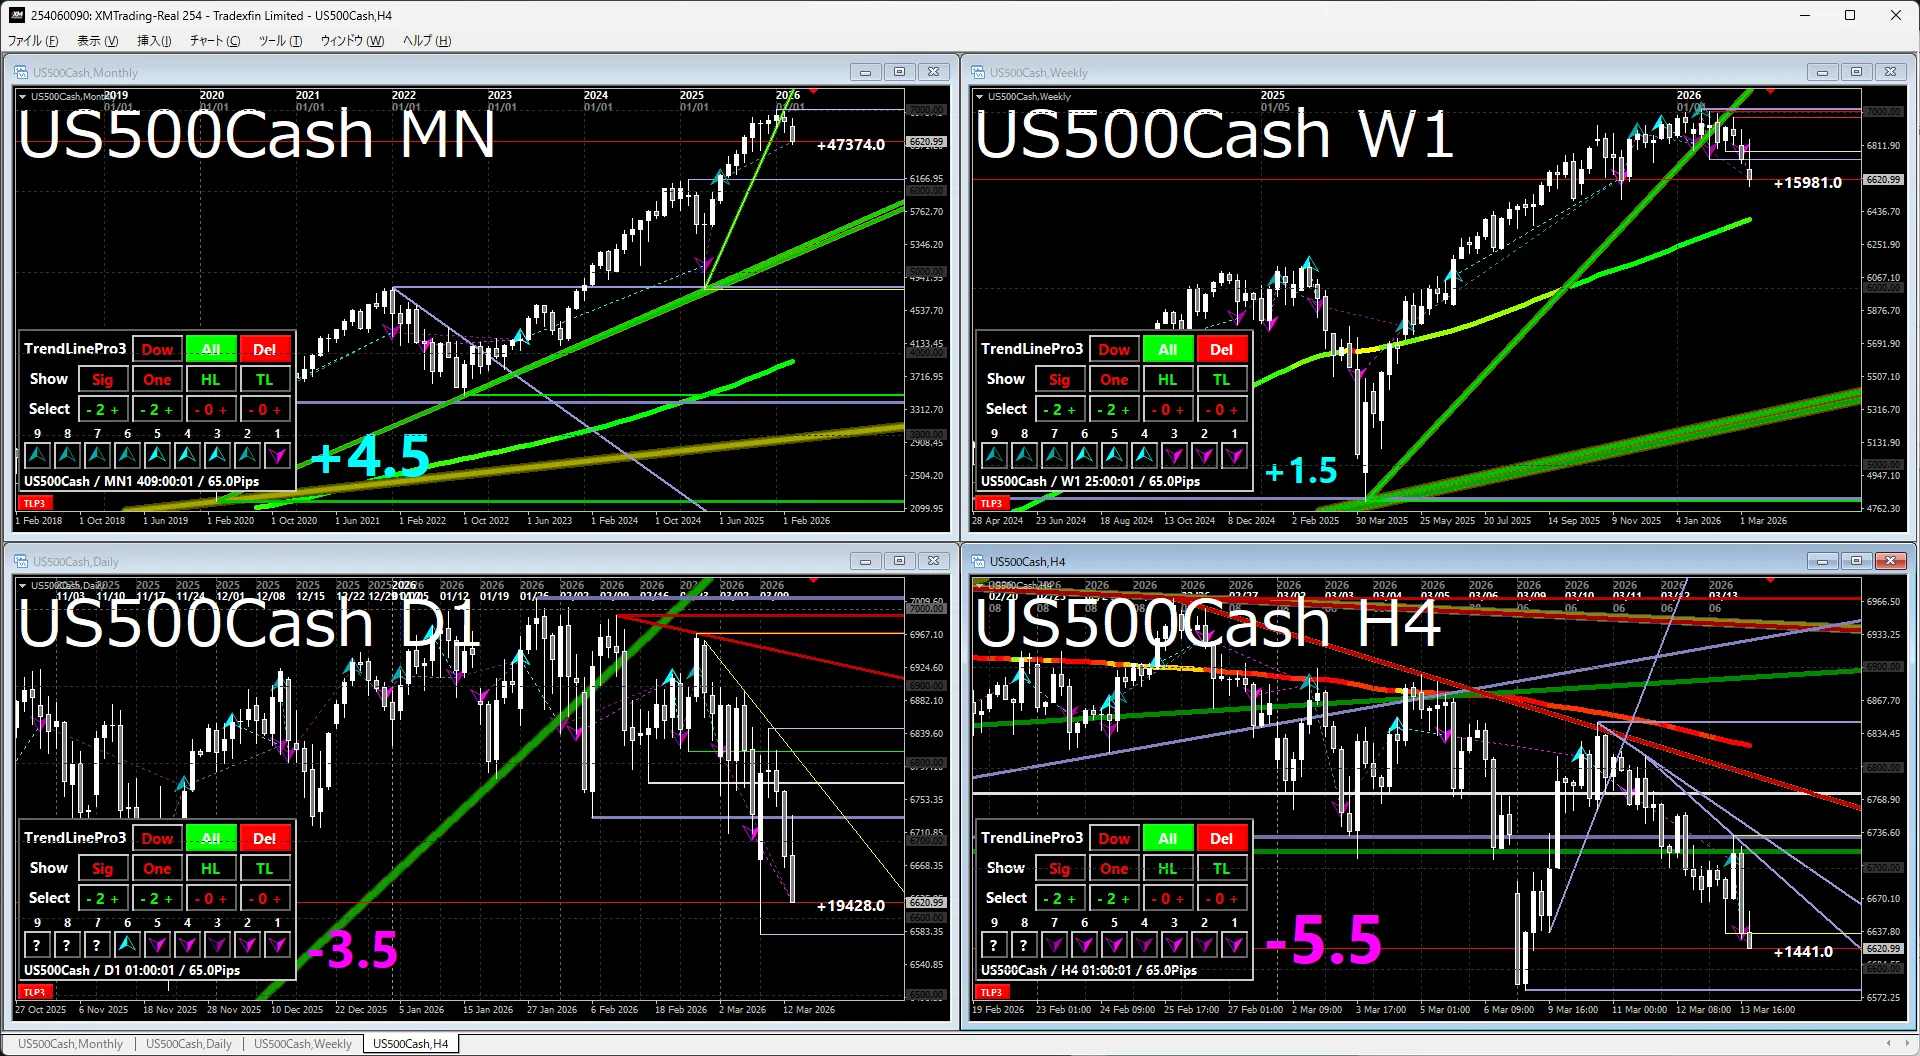
Monthly & WeeklyAfter a rebound from the trendline, it continues to rise, but there is a possibility that it has entered a consolidation phase.
Daily & 4-hourThe score indicates a downtrend, suggesting a potential pullback toward the vicinity of the weekly MA, but personally I think the sideways trend may continue.
Nikkei 225
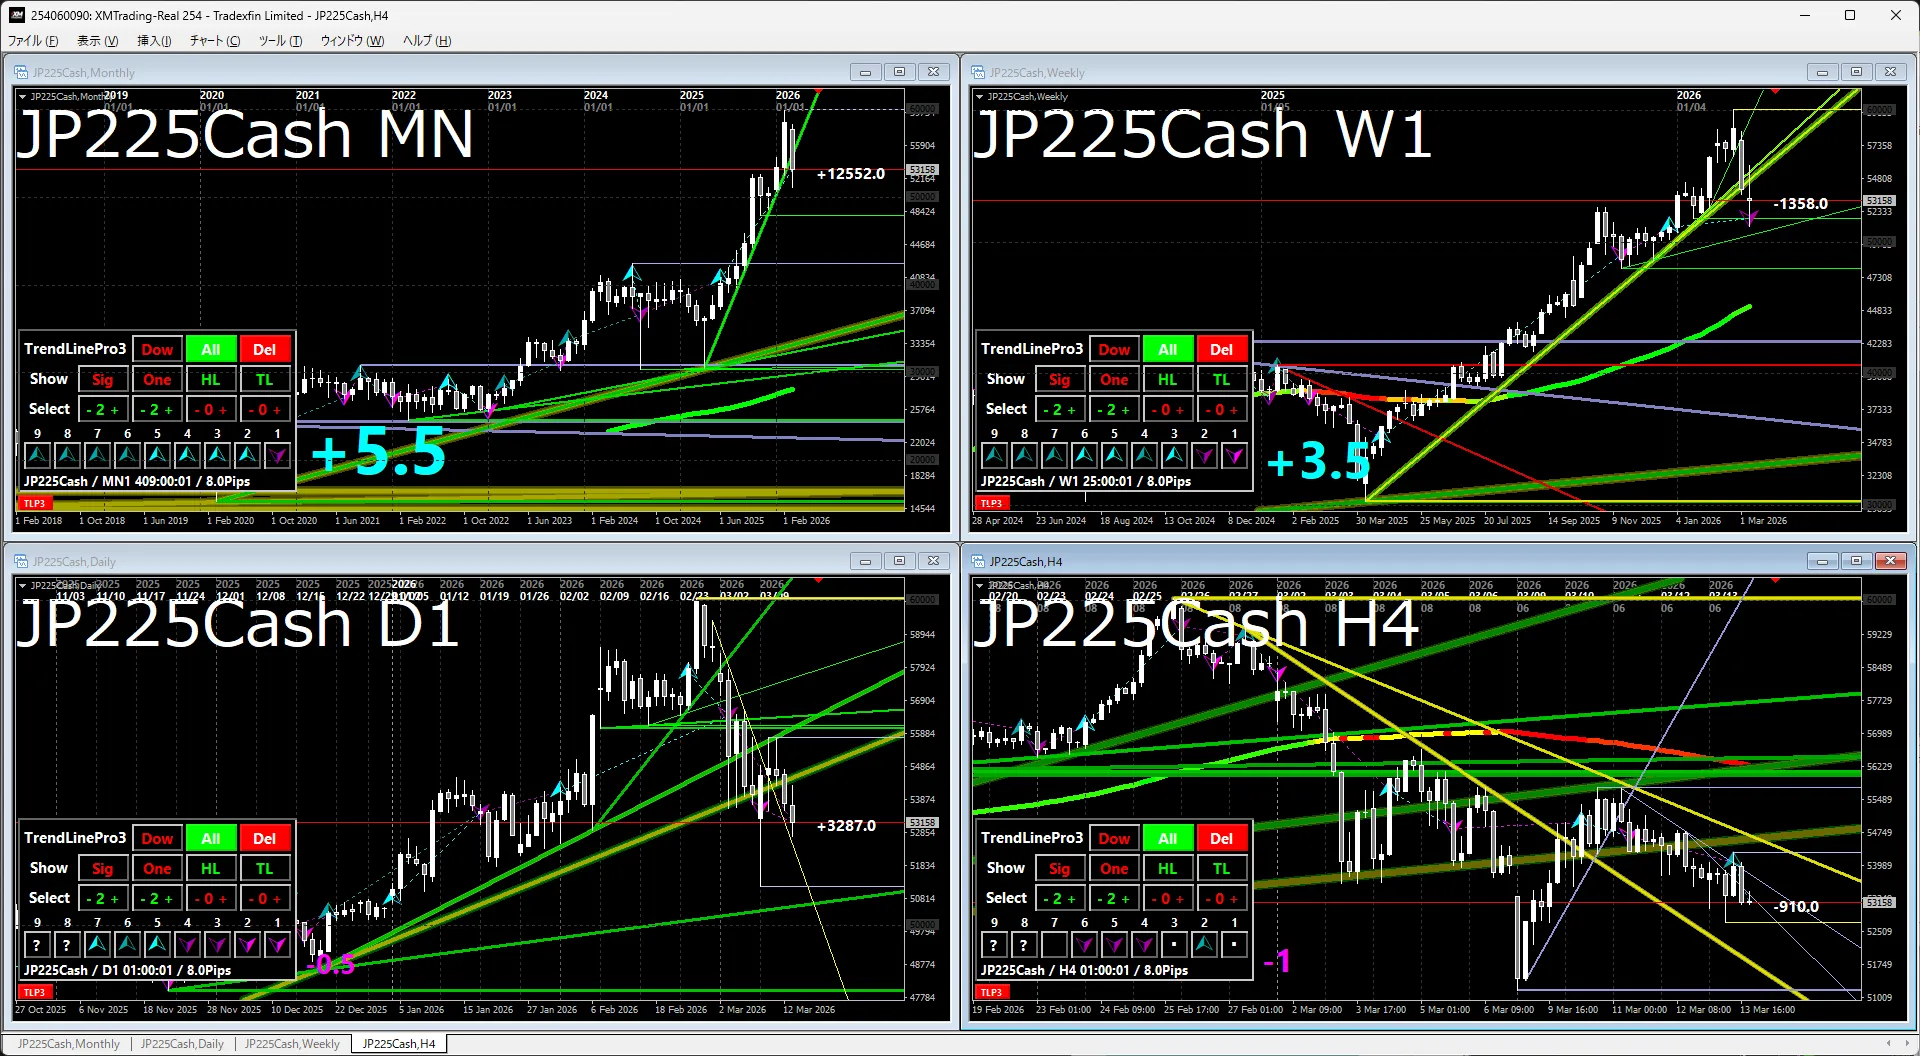
Monthly & WeeklyIt has nearly breached a clearly drawn trendline, but the upward outlook has not yet broken. The upside momentum is weakening.
Daily & 4-hourThe trendline has been clearly broken, but not a reversal downward; rather, the ascent from the relevant angle has ended. It’s unclear how it will move with sudden news, but it has entered a consolidation phase, and the uptrend remains intact.
The indicator in the attached image uses the following indicators.
If you’re interested, please take a look.
I’ve added a ↓ button, but there is no continuation.
If you press it, I’ll be glad.