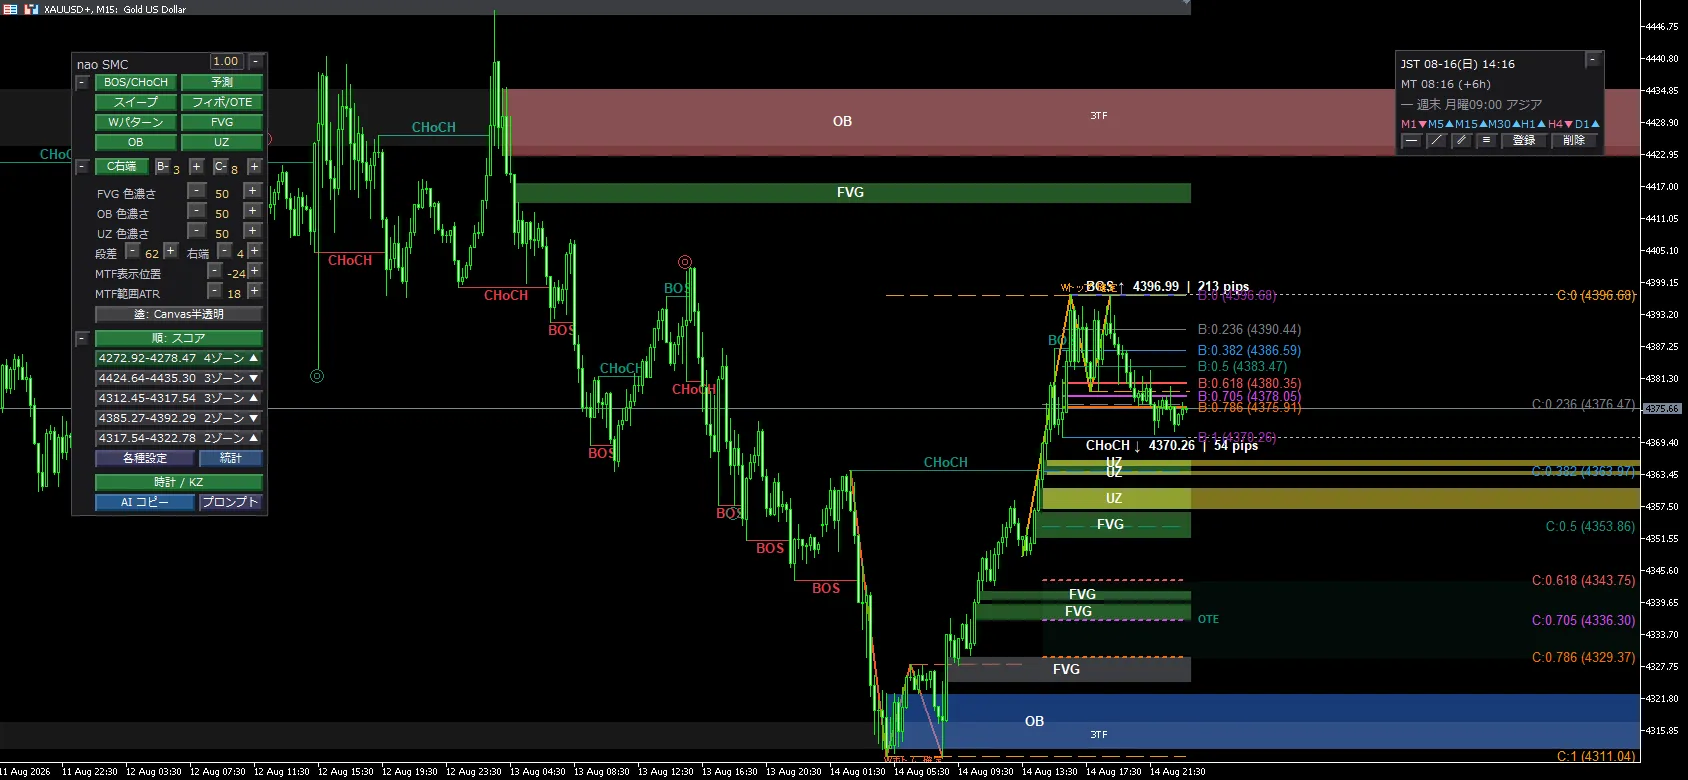

Sell at premium in the 6th round, buy at a discount—the true nature of "0.705" when big players go all-in [SMC Basics ⑥]
Hello,naodesu.
Last time, we explained the “Fair Value Gap” (FVG). The movement that “returns to the price gap,” andOBandFVGoverlap form the highest-precision reaction zone,
this time, to further narrow down the entry zone from the perspective of——Premium-DiscountandFibonacciOTEzone, I will explain.
And within this, there exists a special level called0.705. It is not listed in standard Fibonacci, butit is a core level where big players seriously accumulate positions and is highly valued in the English-speakingICT
What is Premium-Discount?
In the FX world, the basic principle is “buy low, sell high.” This applies to both individuals and institutions.
In SMC, to determine “cheap” and “expensive,” we use the concept ofPremium-Discount.
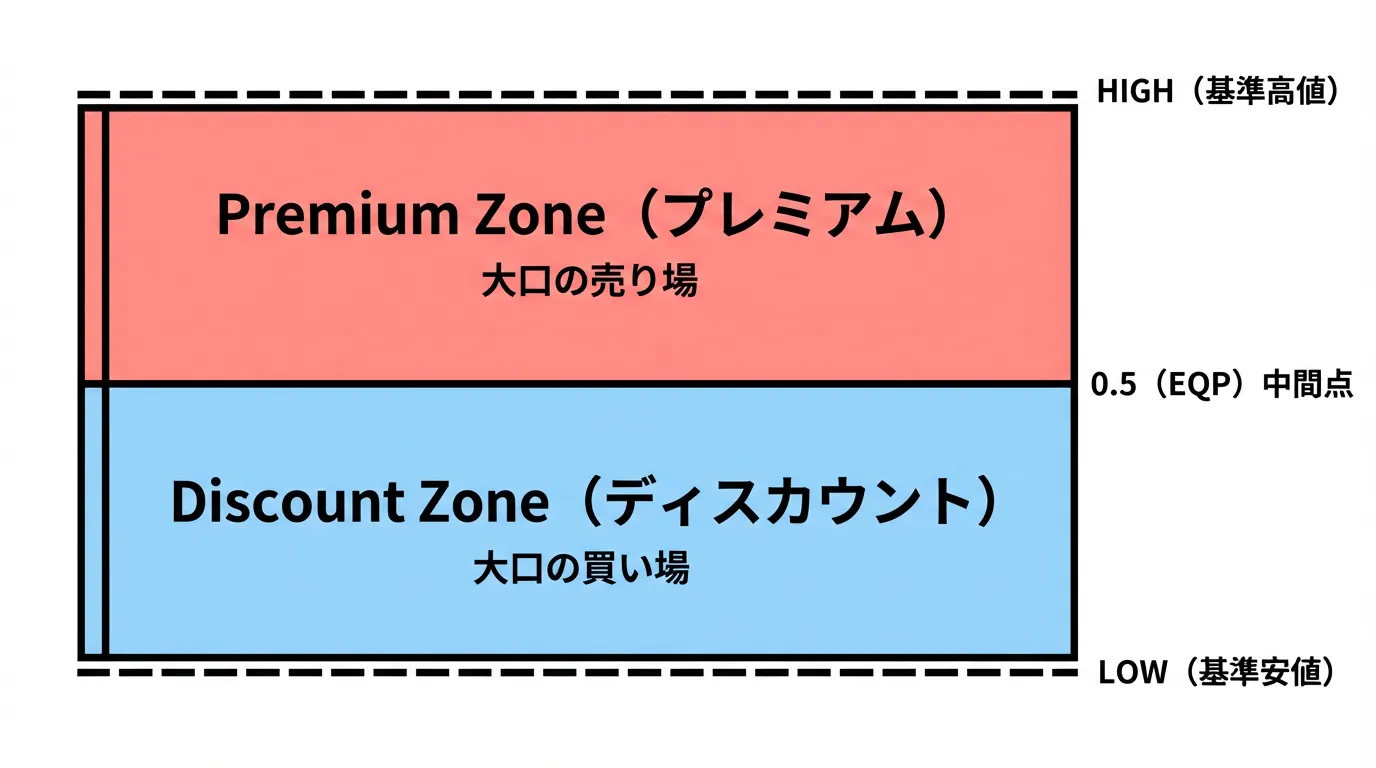
We draw the midpoint between the most recent high and low (0.5 line =EQP) and the area above it is the “premium zone (high price area)” and below is the “discount zone (low price area).””
・Premium Zone (above 0.5): an area that is considered overvalued. Large players place sells here.
・Discount Zone (below 0.5): an area that is considered undervalued. Large players place buys here.
The idea is simple.Large players buy a lot in the cheap places and sell a lot in the high places.Unlike individual contrarian trading, they place the biggest orders at the most undervalued or overvalued spots that can move the market’s supply and demand on a large scale.
OBandFVG, when found, have meanings depending on whether they are in the Premium Zone or the Discount Zone. In a downtrend retracement, the OB in the Premium Zone functions as “the place where big players added shorts.”
OTE Zone — the most precise entry point
We know “sell in premium, buy in discount.” But where exactly in the premium zone should we sell?
That’s where we useFibonacci retracement.
In SMC, Fibonacci is drawn for retracements during a downtrend.
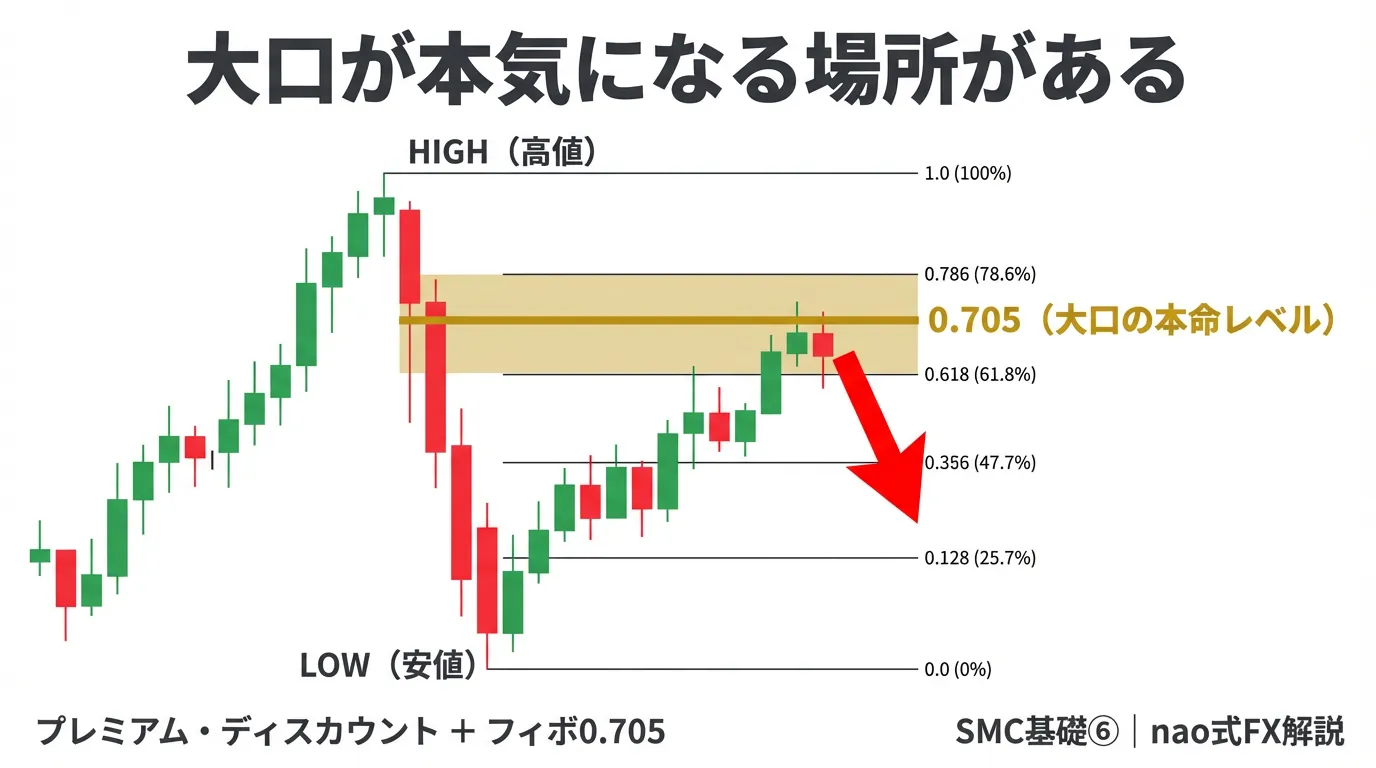
Method: Rising start (base low) = 0, recent high= 1.0 , and draw Fibonacci from high to low.
At this time, the zone between0.618〜0.786is calledOTE(Optimal Trade Entry) zone. In Japanese, “Optimal Entry Zone.”When retracement comes, it is the area where big players most actively accumulate positions..
0.618is the classic Fibonacci level known as the golden ratio, corresponding to the deeper part of the premium zone.0.786is even deeper, close to the highs. Between these two, it is said to be the most cost-effective area for big players to enter.
0.705 — a “core level” not present in standard Fibonacci
OTEZone (0.618〜0.786) has a special number.0.705.
Standard Fibonacci tools do not include0.705.TradingViewdefault settings do not include this level either.
This is ICT’s (Inner Circle Trader) unique concept,ICTproposesthat0.705
.0.618may be still shallow for big players, but when it comes to0.705they place orders with conviction — this is the level.
On TradingView, you can manually add via Fibonacci settings. After adding, you can observe how price retraces surprisingly often stop at this line.
Important point: 0.705 is not a single point but a zone aroundis0.618〜0.786, centered around. It works within the context of the entire OTE zone, not in isolation..
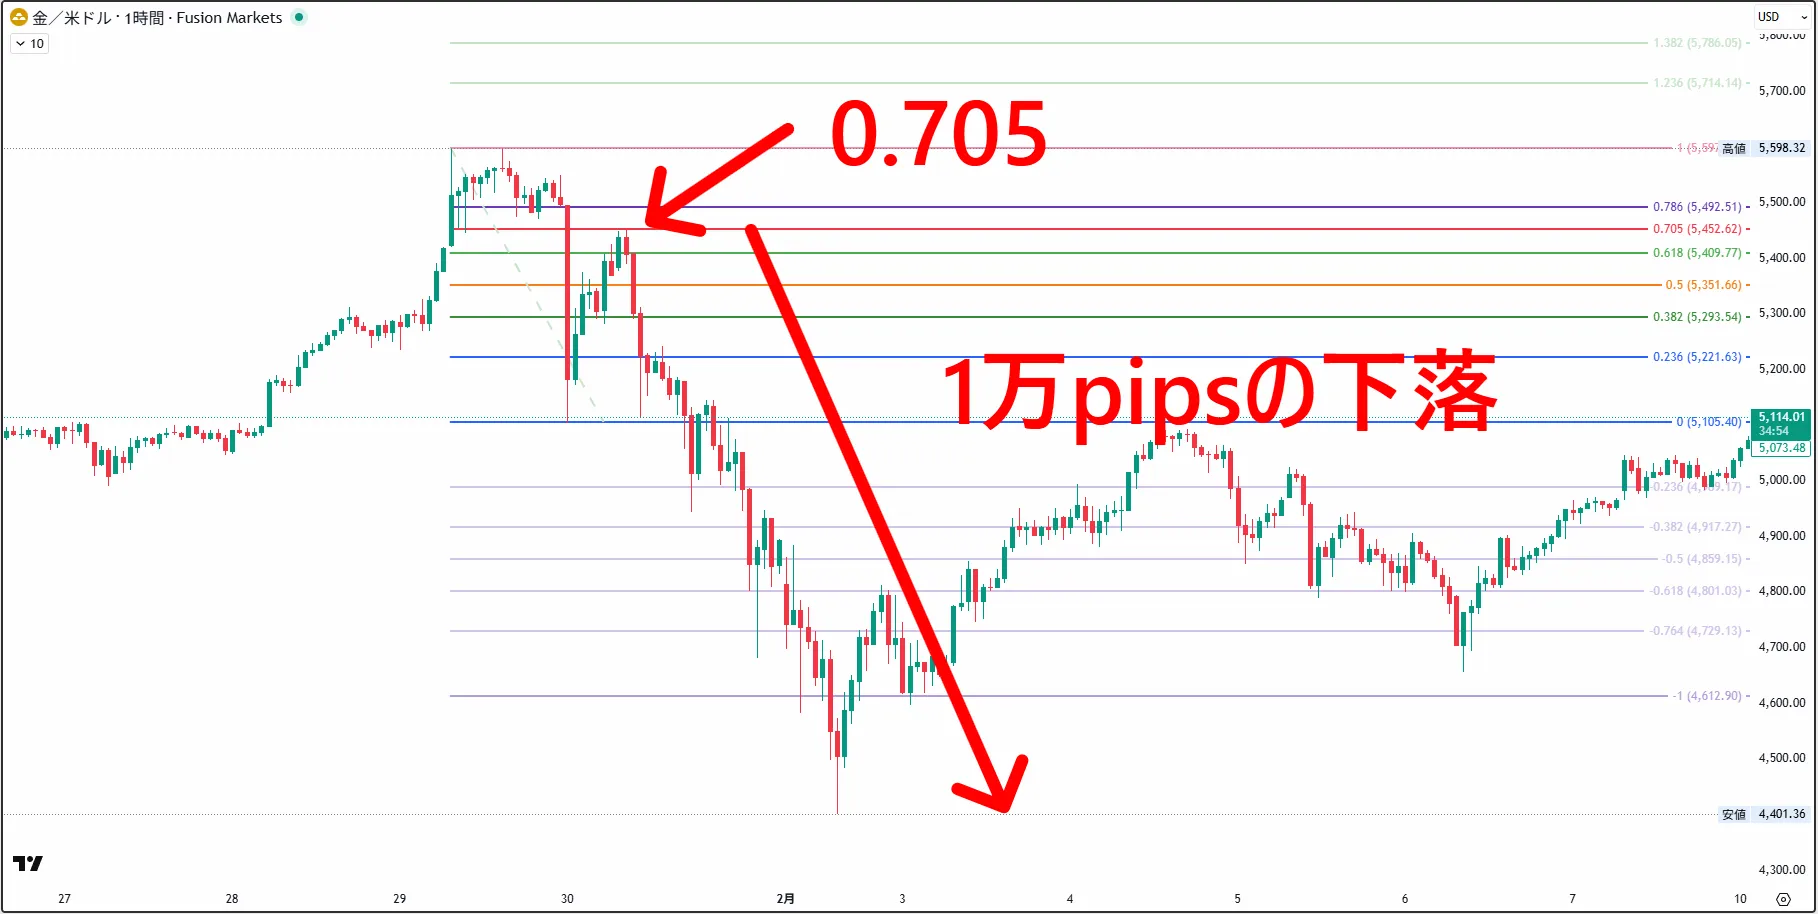
GOLD Jan 29– Feb 2 example — what a 10,000-pip drop proved
To convey the concept, here are recent examples, two cases from the same market, both showing the “double proof” of0.705.
【Case study① Jan 29〜Feb 2:0.705 topped out and a decline of over0,000.
Jan2026年129GOLDhit a high of5,598.32.
From the recent high (5,598.32) to the prior low (), a Fibonacci retracement shows the level at.
4,900 PIPSfirst (to around5,106.41). Then it rebounded and—()exactly hit and then dropped to a final low of, a drop of about. All of this occurred between 1/29 and 2/2.
functioned as a ceiling, and big players were accumulating shorts at that level, confirmed by the numbers.
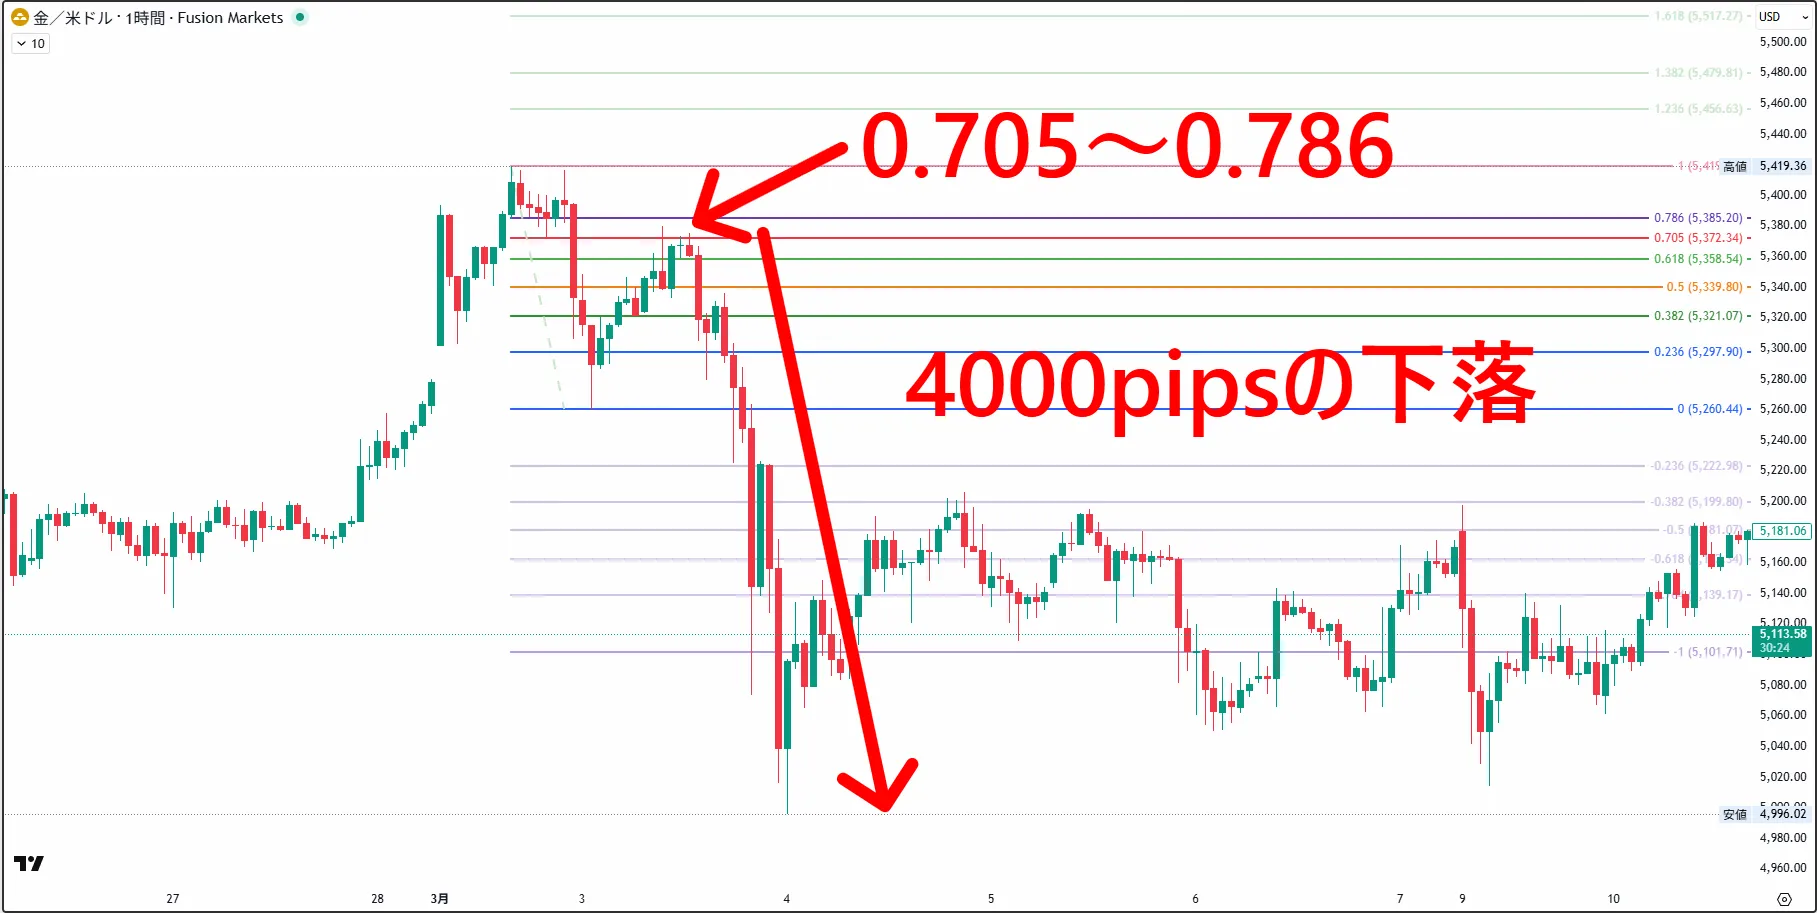
【Case study〜:another rapid drop also〜 served as the ceiling】
This is a different scenario from Jan 29.28fell roughly from the high (5,419.36) to a low around4,... .
After this drop, measuring the retracement shows that the pullback from the high to the trough landed within the 0.705–0.786 zone, and then a further substantial downward move occurred (to around).
〜 in the, aligning theory with real-world outcome.
Nao’s Honest Opinion: I encountered Fibonacci before SMC
In fact, I started using Fibonacci long before learning SMC.
Back then, I used it by viewing the range from “Fibonacci 50 to 61.8” as a zone. The sense that “if price retraces from 50% back to about 61.8% it tends to reverse” is something many traders intuitively use.
After learning SMC, I realized that the level I thought was the “upper boundary” of a zone, 0.618, was actually the entrance to theOTE zone.〜0.786defines thezone, and the area just above the level I thought would stop price is where big players start moving in. And the core is0.705..
And this is something I could predict before actually trading (see the LINE screenshot below).
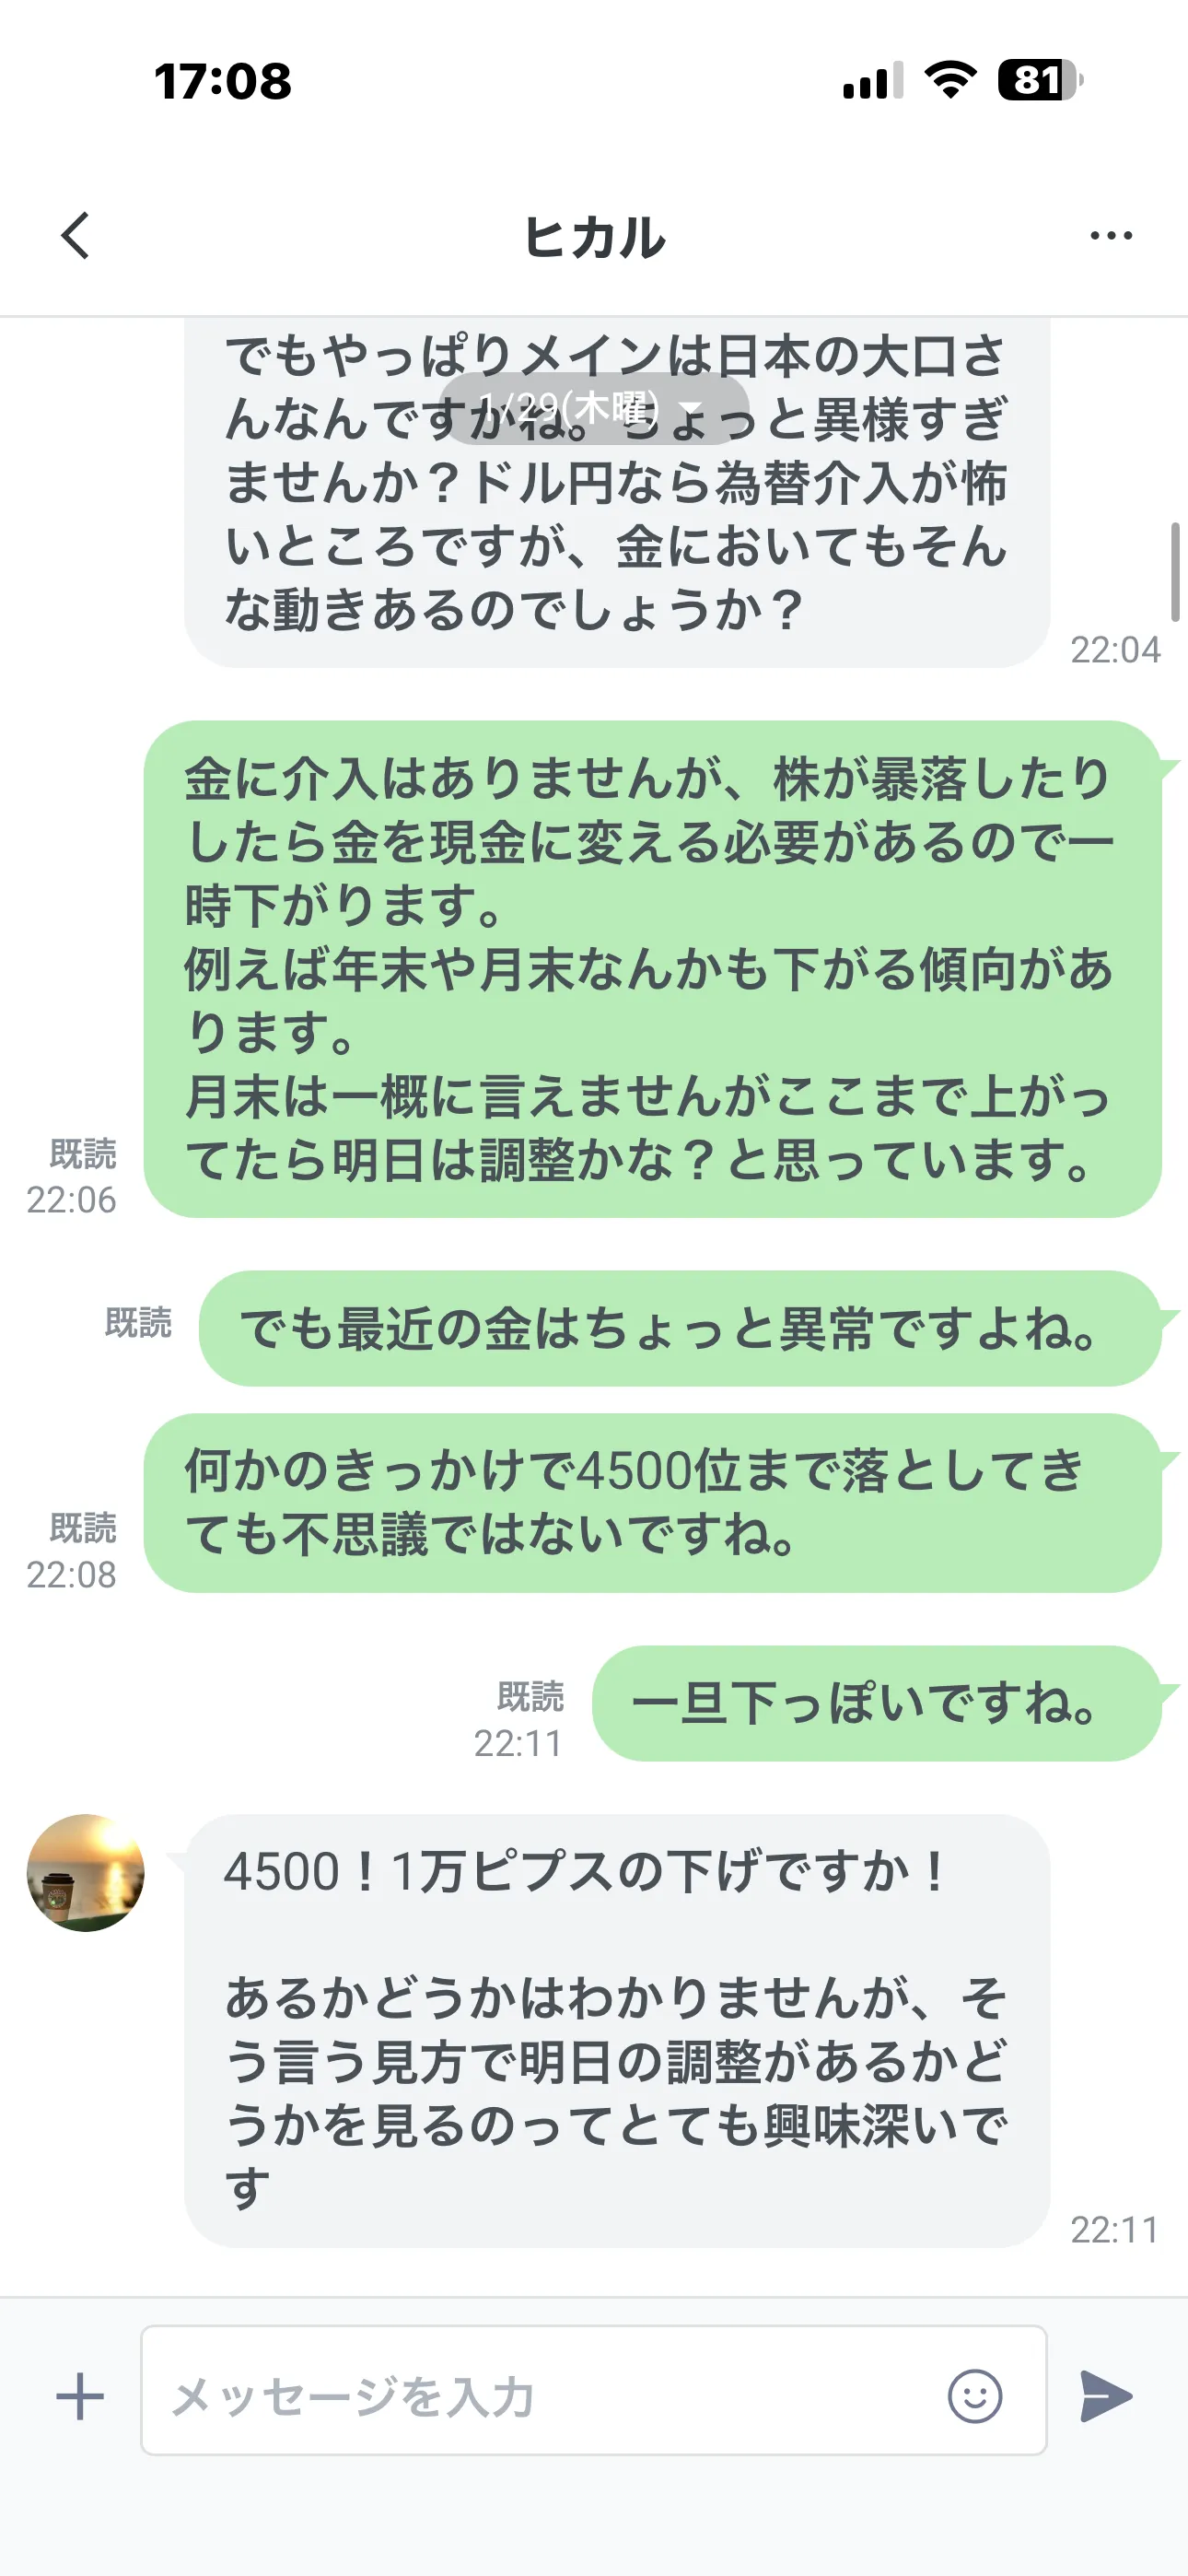
What actually triggered the drop was the following day, Jan 30—news of the nomination for the next FRB chair (Warsch): a hawkish candidate. But the sequence wasn’t that the news moved the market first. The market had already prepared for selling in the premium zone, and the news acted as a trigger—state first, trigger later. That’s the correct interpretation.
Then, what determined where the retrace would stop after the drop was 0.705.Regardless of the trigger, the main flow follows thezone.This shows the strength of 0.705.
Summary: Today’s 3 Key Points
①Premium (above 0.5) is where big players sell; Discount (below 0.5) is where big players buy.OBandFVGshould be checked to see which zone they reside in first.
②OTE zone (0.618〜0.786) is the main area for entry on retracements.When a retracement in a downtrend reaches here, big players scale up their positions.
③0.705 iszone’s core level.It does not exist in standard Fibonacci; it is ICT’s unique figure, but has been repeatedly confirmed in GOLD real-life examples as “where big players get serious.”and
Next time: Multi-timeframe analysis — a top-down analysis flowing from higher to lower timeframes. Layering Premium-Discount across multiple timeframes can identify even more precise entry zones.
Thank you for your continued support!
─────────────────────
nao|FX full-time trader and EA developer
I started sharing SMC after discovering that my self-taught winning patterns aligned with what later came to be called SMC.
Specializing in GOLD scalping and day trading. While selling the “tundere series” EAs on GoGoJungle,
I developed the SMC-visualization indicator “nao_smc_mt5” that maps the same decision criteria onto charts.
From structure, zones, 0.705, to the next breakout forecast—onto the chart the moment you open it.