
Episode 1 Title: A Talk to Ensure You Don’t Get the “Direction” of the Chart Wrong. How to Read Market Structure [SMC Basics Part 1]
Hello, I’m nao.
This time I will explain how to read the “market structure.”
This is the foundation you should learn first when studying SMC. If this part remains vague, no matter what method you use, the fundamental mistake of “taking the wrong direction” will continue.
What is market structure?
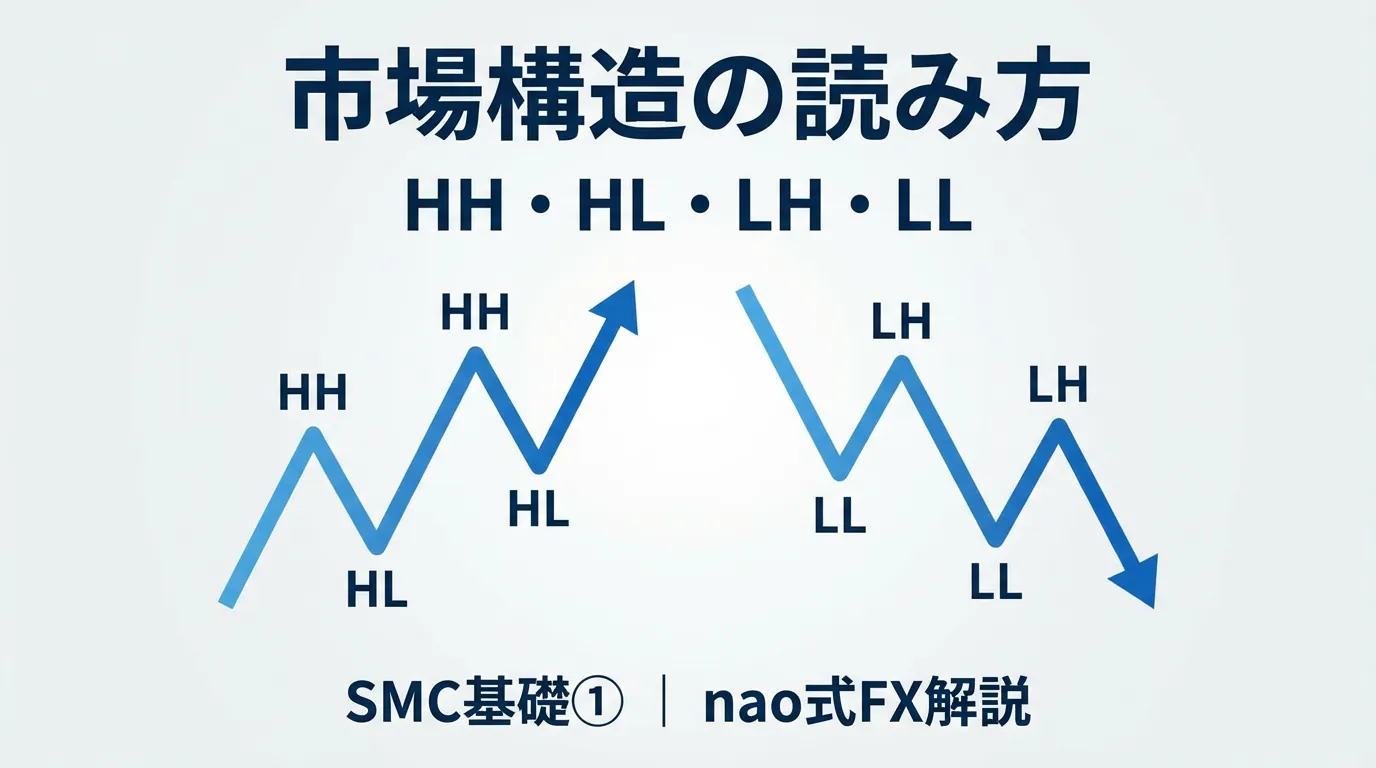
Market structure refers to the pattern of “consecutive highs and lows” on the chart.
An uptrend is composed of “rising highs and rising lows.” A downtrend is composed of “falling highs and falling lows.”
In SMC, this is organized into four terms.
HH (Higher High): a high higher than the previous high
HL (Higher Low): a low higher than the previous low
LH (Lower High): a high lower than the previous high
LL (Lower Low): a low lower than the previous low
If HH and HL are continuing, it’s an uptrend. If LH and LL are continuing, it’s a downtrend. That’s all there is to it.
Why this is important
If you “look at the chart and guess the direction” without a clear understanding, you’ll fall for fake breakouts.
For example, during a downtrend there are moments when prices temporarily rise. If you judge this as “it’s turning up” and go long, it’s common to be pushed down again afterward.
If you read market structure accurately, you can判断 that it’s still at the LH stage and there’s no basis for a rise yet.
If you don’t misjudge “where to enter,” the way you lose changes fundamentally.
To avoid missing reversal signals
When a trend reverses, the first thing that happens is“a change in structure”.
From uptrend to downtrend reversal: break below HL
From downtrend to uptrend reversal: close above LH
This “change in structure” is called CHoCH (Change of Character) in SMC. I will explain CHoCH in detail next time, but for today please remember that a trend reversal occurs when either HL is broken or LH is broken.
Check in actual charts
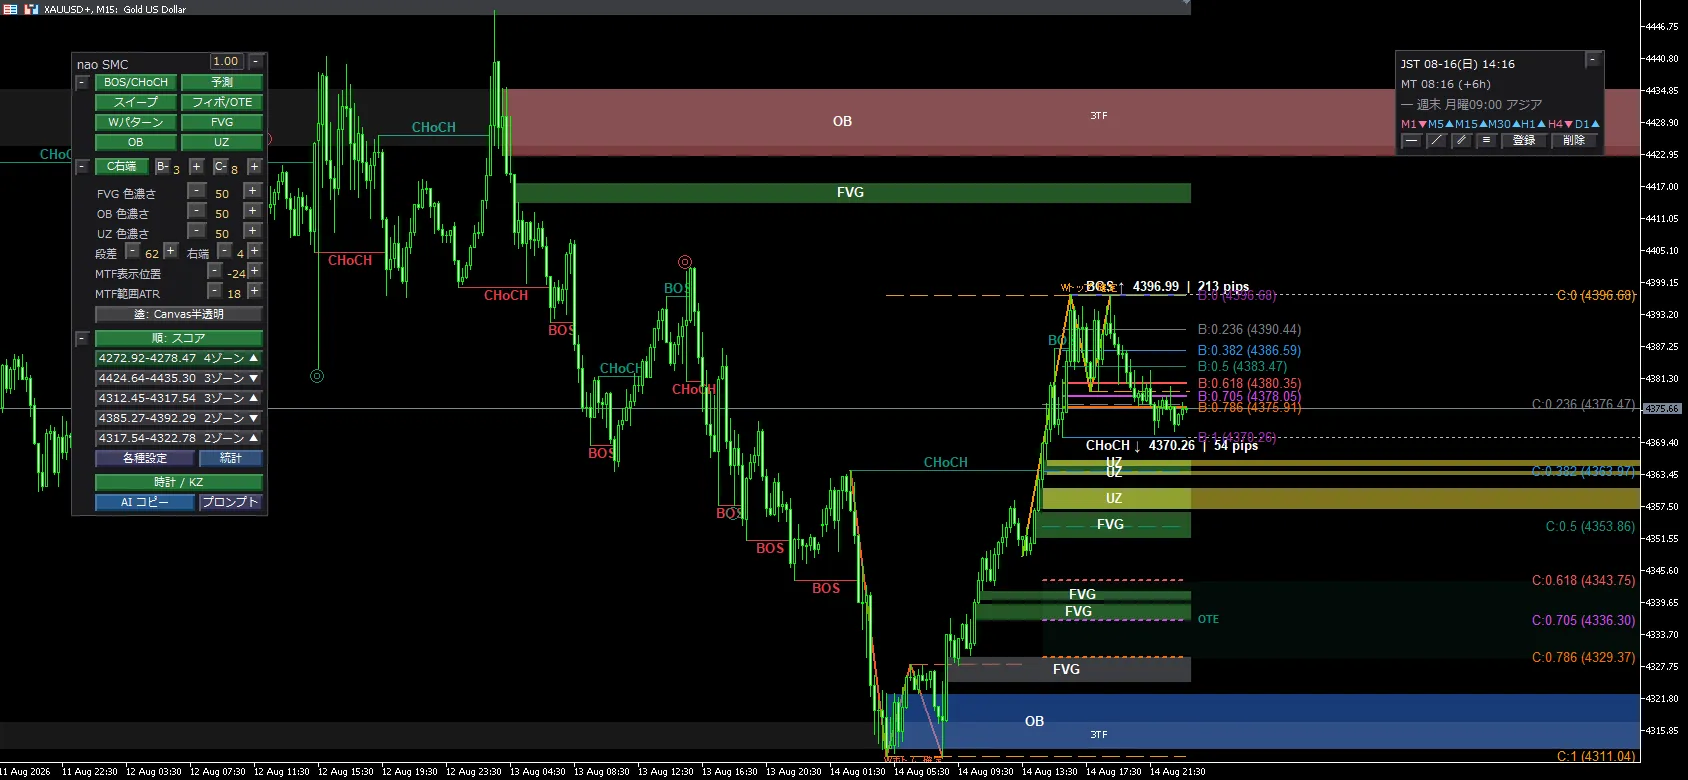
Let’s look at GOLD charts as an example.

This is the TradingView screen of one-hour Gold that I usually use.

This is easier to understand.
First check market structure on higher timeframes (4-hour, 1-hour), then look for entry points on lower timeframes (15-minute, 5-minute). This top-down order is the basic idea of SMC.
I will explain multi-timeframe analysis in detail again later.

Summary: Today’s 3 key points
─────────────────────
nao | FX full-time trader and EA developer
Having learned winning patterns by myself, I later learned that they are called “SMC,” and began promoting SMC widely.
Specializing in GOLD scalping/day trading. While selling the EA “tundere series” on GoGoJungle,
I developed the SMC visualization indicator “nao_smc_mt5” that maps the same judgment criteria onto the chart in real time.
From structure to zones to 0.705 to the next breakout forecast — onto the chart the moment it opens.