

A quick way to find where it’s easiest to win
Reviews & videos can be viewed here
- Uptrend(Up Trend):Higher highs and higher lows, moving in an upward-sloping manner.
- Downtrend(Down Trend):Lower highs and lower lows, moving in a downward-sloping manner.
That’s what it means.
So, now? When trading in places that are not yet in that form, you look for and confirm them.
Places where highs and lows have not both been updated, where a new high is being formed but the low is not, or places that deviate from the trend definition.
Whether you notice this or not will affect the edge of your position.
For example, many-billionaire traders, when they find such range points, chase the scene as the range breaks and forms a trend using signals of buy/sell on an ultra-detailed 1-minute chart, and construct positions along the Billionaire Trader line.
Please check this before entering the market.
Dollar-Yen 1-hour & 1-minute charts
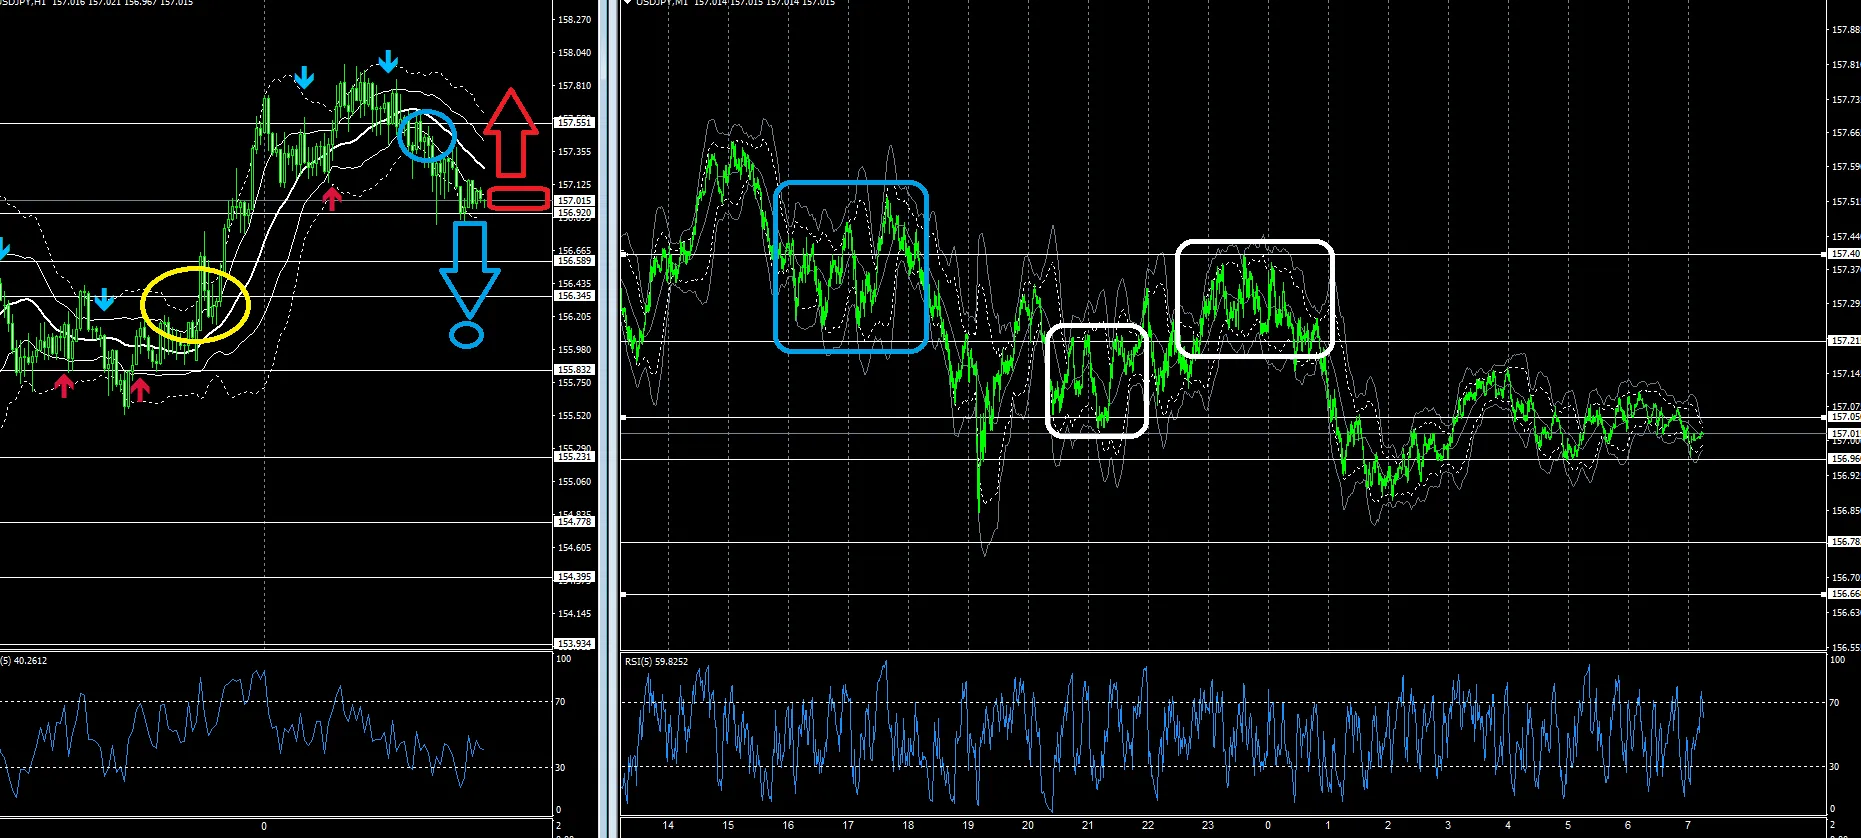
The 1-hour chart sees the yellow circle as the initial downward target.
If it continues to fall, the blue circle will be around 15,600.
In a rally, a range forms with red squares, and then possibly aims for the recent high again??
What I just described in the article is a scene like the blue-white circle on the 1-minute chart.
Generally, the price tends to breakout from such scenes and the market expands.
The price action is similar in width though different in specifics, so I think you should watch a little more closely.