
Dollar-Yen NY close analysis
Analysis of the USD/JPY NY close.
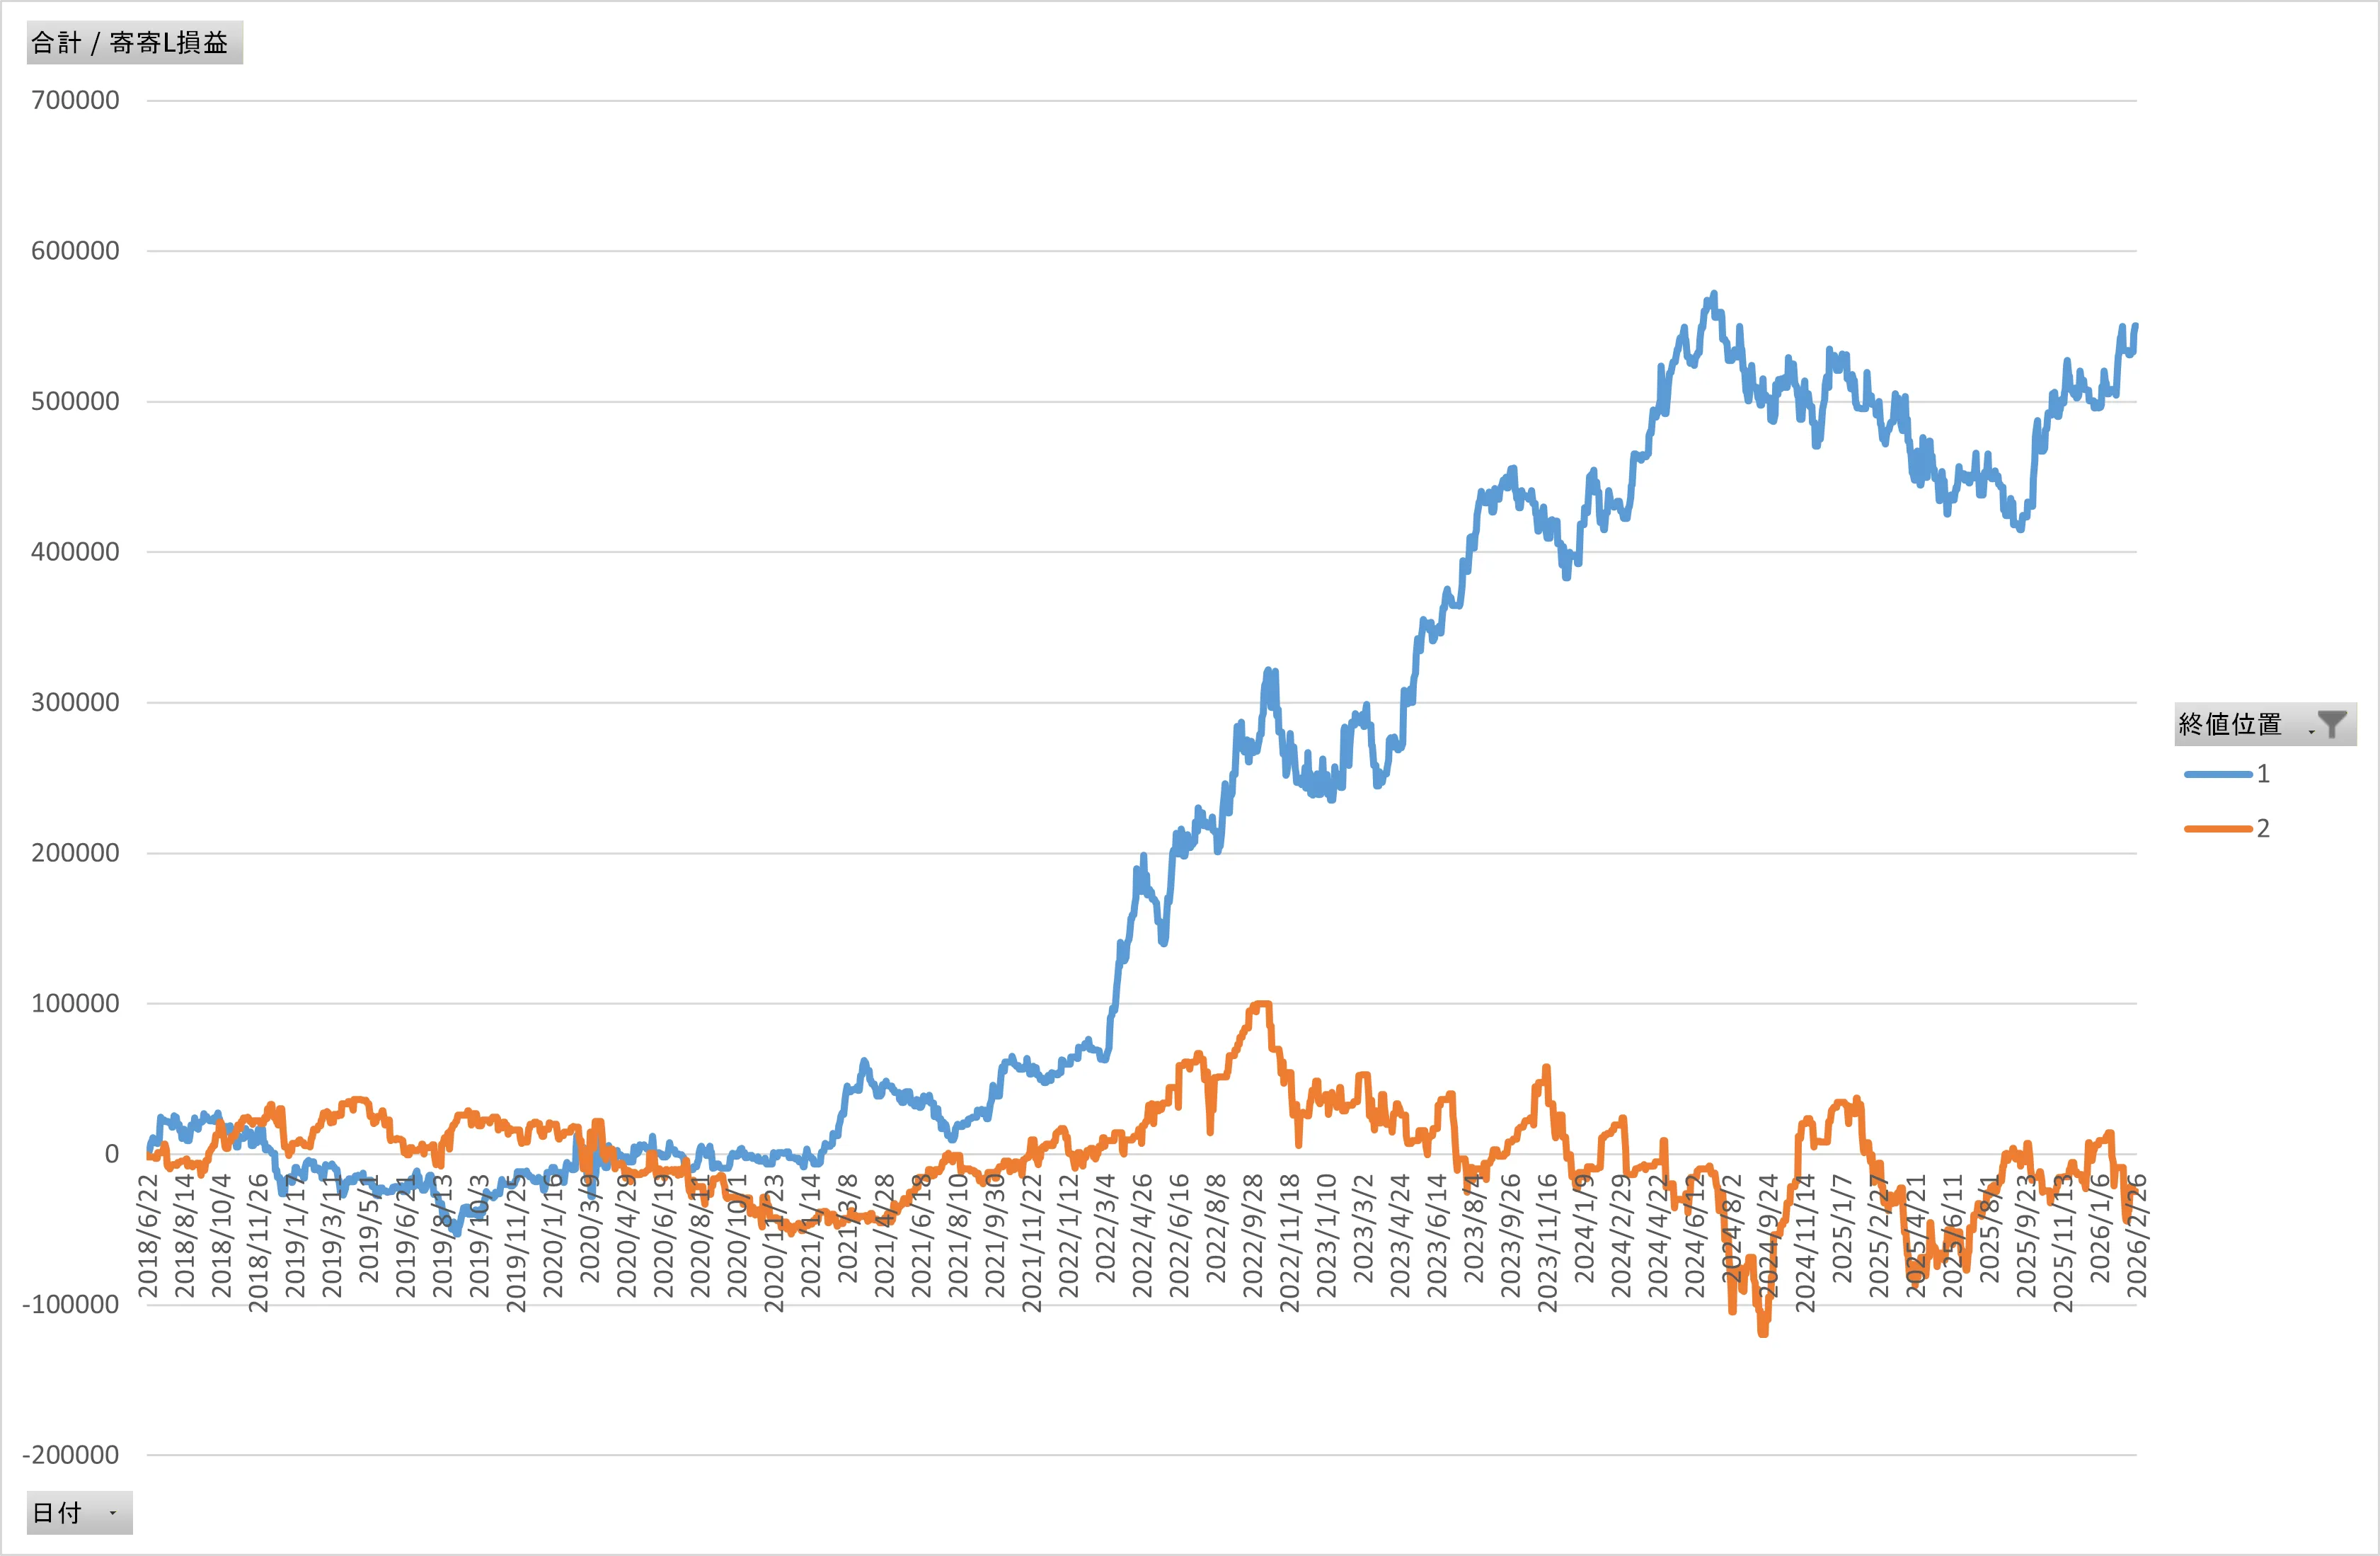
There is a decisive difference in the profit curve between days that closed above or below the previous day's high/low by more than 50% (blue) and the days below (orange).
A bullish day that closes in the upper half of the range visualizes that the ongoing trend-following edge remains extremely high in subsequent days.
Conversely, closes in the lower half tend to stall. This filter is powerful! #USDJPY #FXMethods
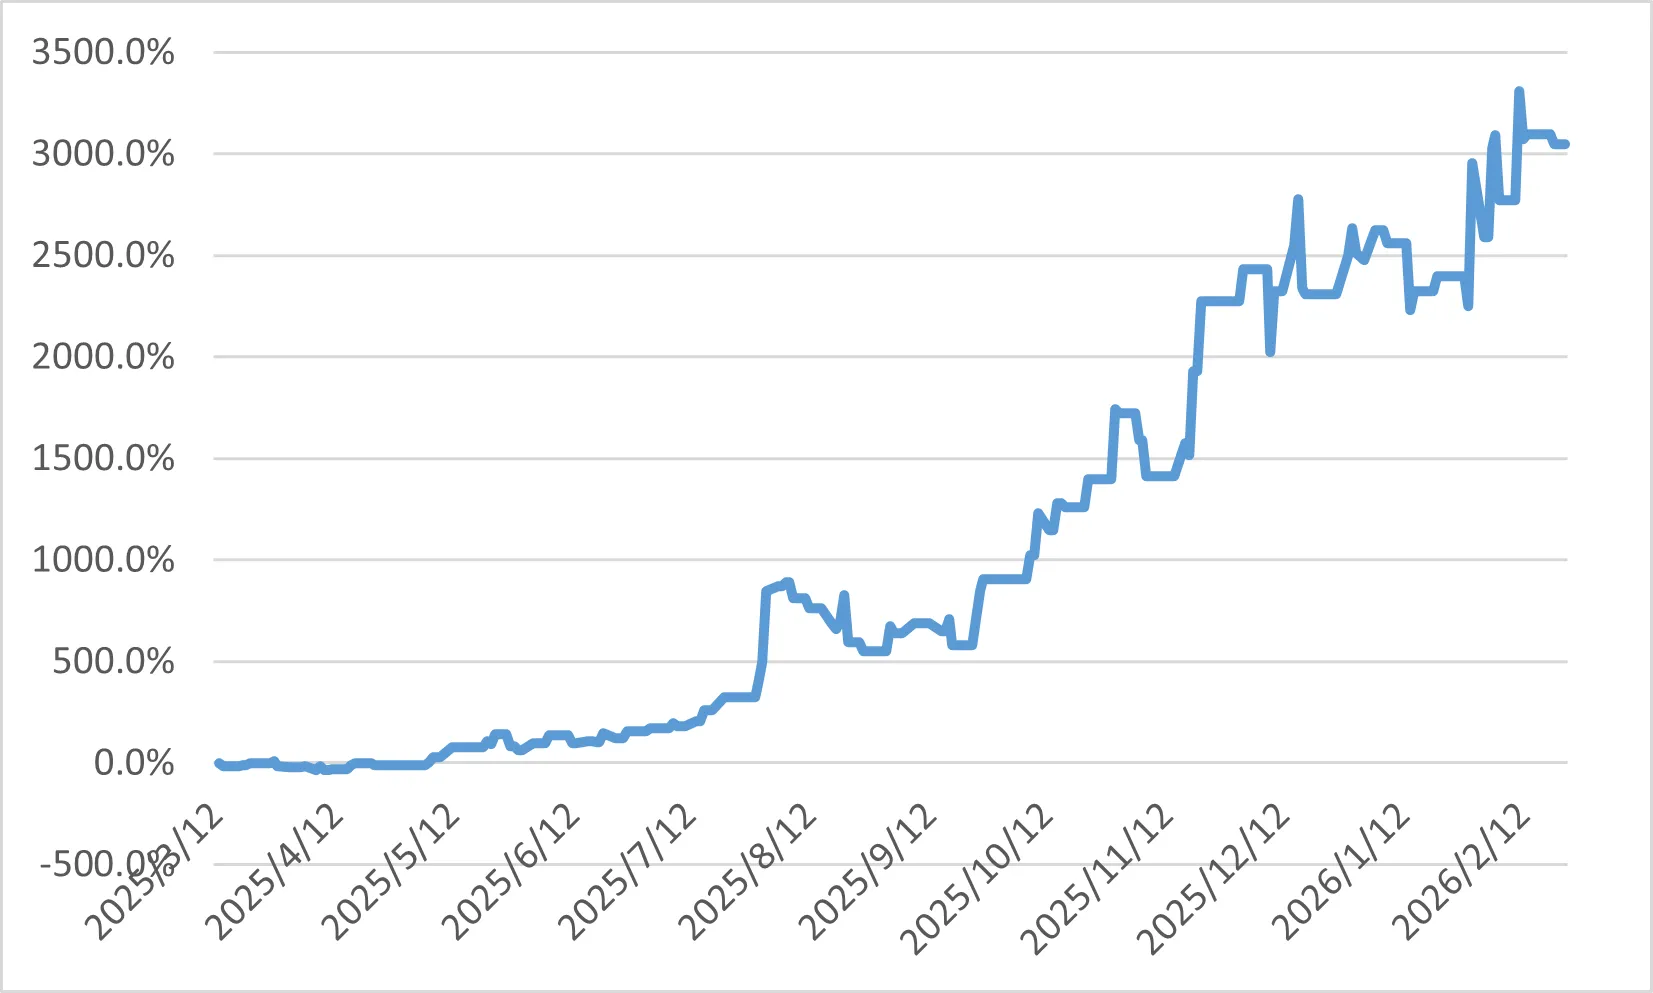
【USDJPY Short-Term Model】
Achieved +3000% annual return with 25x full leverage! MDD is 50%, but the account did not blow. Starting with 1 million yen aiming for 30 million yen in real capital.
Logic is ultra-simple. It is a quantitative analysis using features highly correlated with overseas indices and macro indicators. The key is compound growth using a betting system.
If you want to grow your assets, it’s far more impactful to focus on the effectiveness of betting than on figuring out where to buy or sell.
No automated trading required. Just place a new order and LC order between 8 and 9 a.m. in the morning.
‘Annualized return of 3000%. USD/JPY at the extreme of correlation — an investment strategy derived from macro indicators —’ ‘Tired of the candlestick deceiving you. A fundamental FX trading model that wins by understanding the causal relationships of the world economy.’
https://www.gogojungle.co.jp/tools/ebooks/75653?via=users