

【BTCJPY】20190312 Daily Pivot
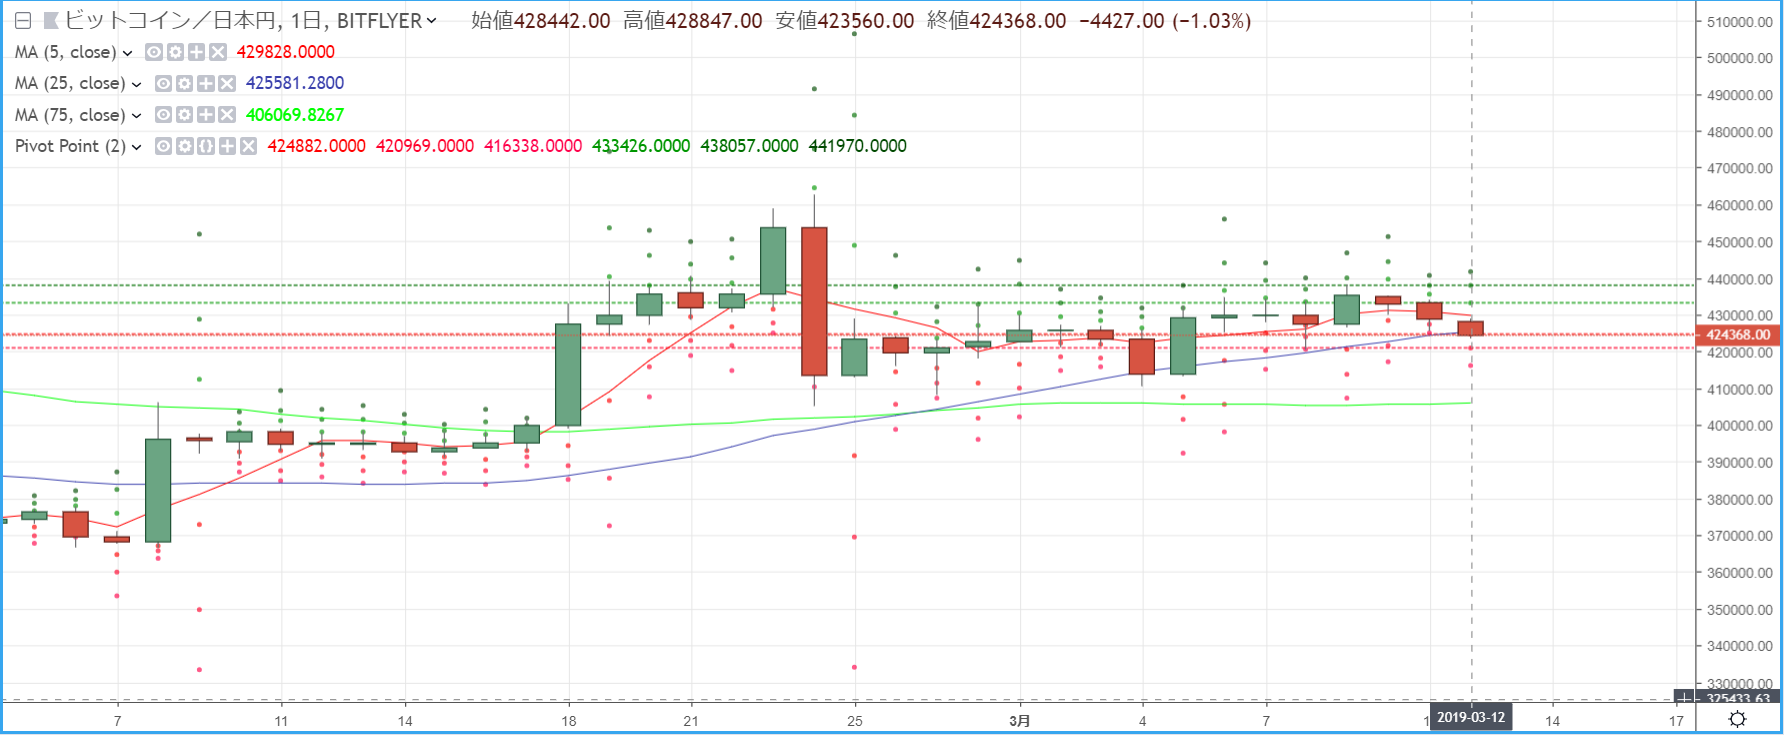
R2=438,057
R1=433,426
S1=424,882
S2=420,969
* Pivot points are a technical indicator that predicts the expected price movement for the day based on the previous day's price action. Centered on the Pivot Point (PP), draw resistance lines (R1, R2) above and support lines (S1, S2) below, and use them as trading参考 guides.
[Calculation Formulas]
Pivot Point (PP) = (Previous day close + previous day high + previous day low) / 3
Resistance Line 1 (R1) = PP + (PP - previous day low)
Support Line 1 (S1) = PP - (previous day high - PP)
Resistance Line 2 (R2) = PP + (previous day high - previous day low)
Support Line 2 (S2) = PP - (previous day high - previous day low)


