

【BTCJPY】20190308 Daily Pivot
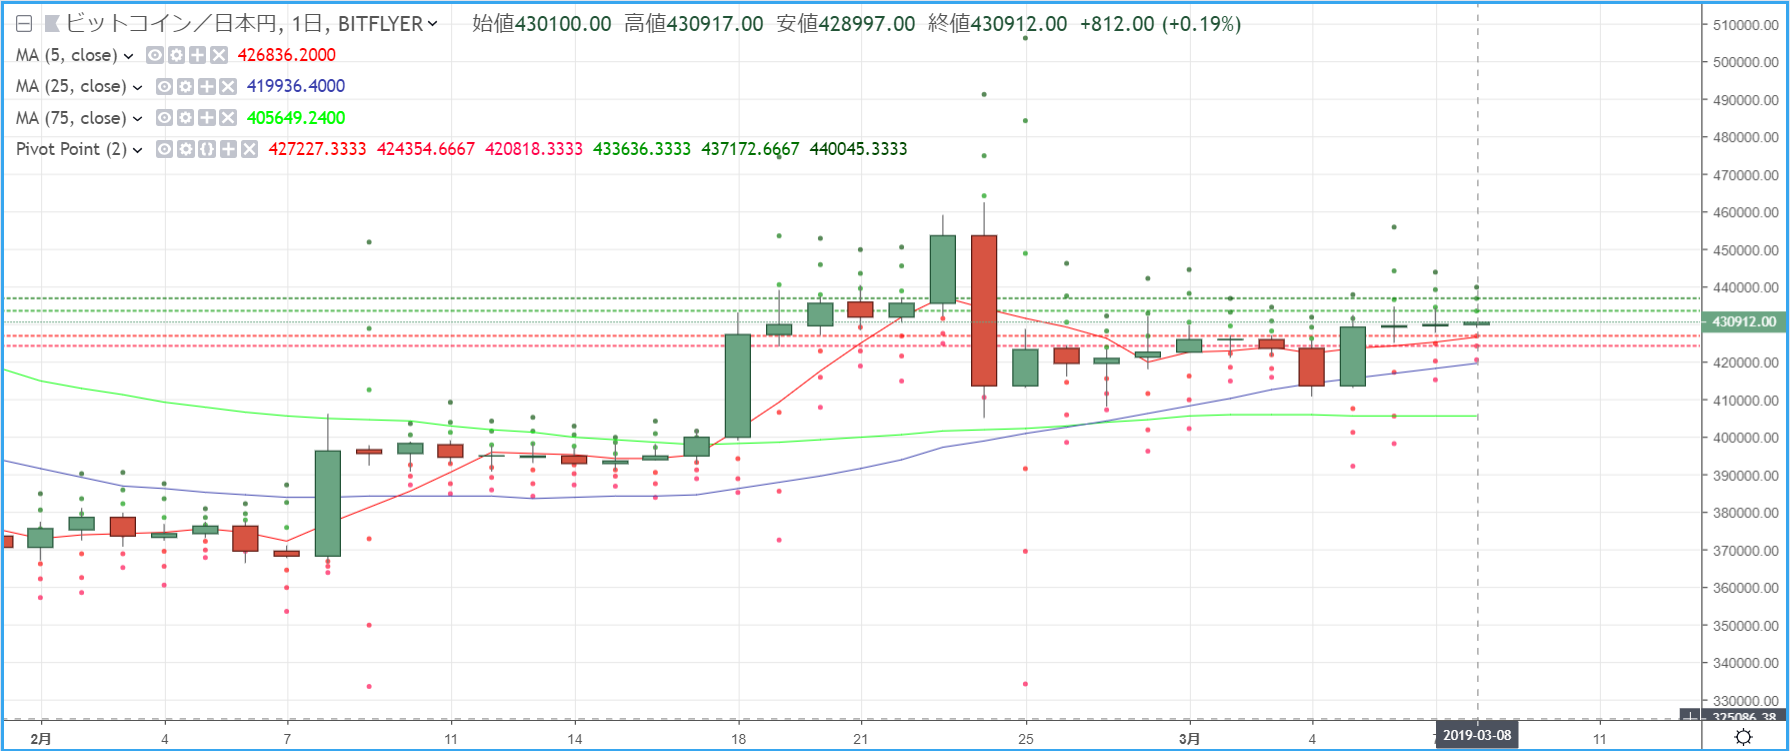
R2=437,172
R1=433,636
S1=427,227
S2=424,354
※ Pivot refers to a technical indicator that predicts the range of price movement for the day based on the previous day's price action. Centered around the Pivot Point (PP), resistance lines (R1, R2) and support lines (S1, S2) are drawn, and traders use them as trading guides.
[Calculation Formula]
Pivot Point (PP) = (Previous Day's Close + Previous Day's High + Previous Day's Low) / 3
Resistance Line 1 (R1) = PP + (PP - Previous Day's Low)
Support Line 1 (S1) = PP - (Previous Day's High - PP)
Resistance Line 2 (R2) = PP + (Previous Day's High - Previous Day's Low)
Support Line 2 (S2) = PP - (Previous Day's High - Previous Day's Low)


