2026/1/24 Dollar-yen, Gold, SP500, and Nikkei 225 Environment

『TLP2-MA Moving Average』✖『Daw sag Break Edge 9』
▶One word◀
『Daw sag Break Edge』 has added 5→9→ lines.
It has become a practical Trend Line Pro 3 level performance.
Since this is a good opportunity,
from today, I plan to reflect the provisional Trend Line Pro 3 on the chart.
This time, it is very commonly monitoredTLP2-MA (Moving Average)added.
The number of displayed lines is reduced, but please use it as a reference for how much it is monitored.
By default, only the most recent one of the 1–9 breaks is displayed.
It can be easily switched with button operations.
▲Light blueis the upper break (darkLight blueis the inverted triangle break)
▼Pinkis the lower break (darkPinkis the inverted triangle break)
■ Symmetrical triangle (on the chart, a small white circle appears)
USD/JPY
↓Last week's chart↓
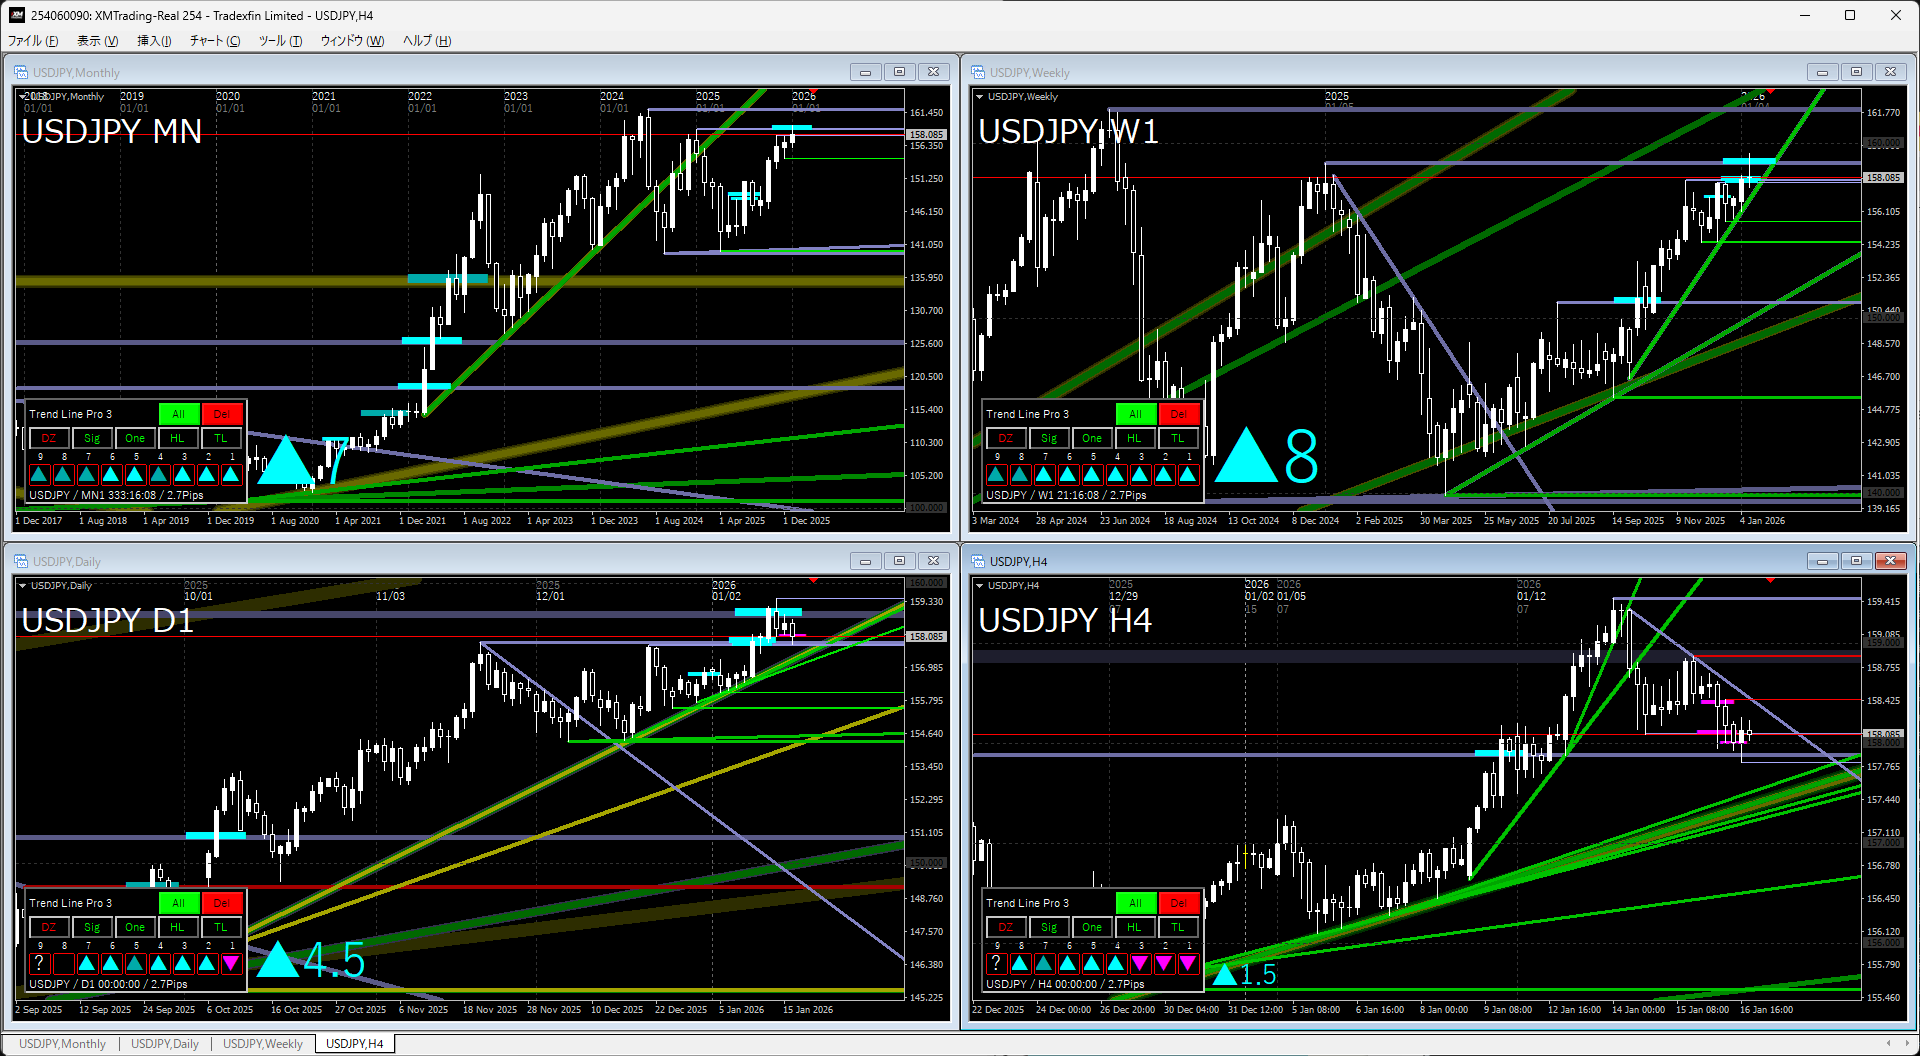
↓This week's chart↓

Monthly & WeeklyThere is no image change from last week, but I had expected a temporary adjustment phase.
In fact, the divergence with the weekly MA added this week is part of it.
Long-term, the upward (yen depreciation) shape has not broken, but it seems to be entering a phase of daily time adjustments.
Daily & 4-hourLast week, I imagined a possible temporary adjustment.
Later in the week, with rumors of government involvement causing a sharp drop, I think it is a reasonable place to correct speculative surge.
As a time-based adjustment, the daily (weekly) MA seems to be more in focus.
Gold
↓Last week's chart↓
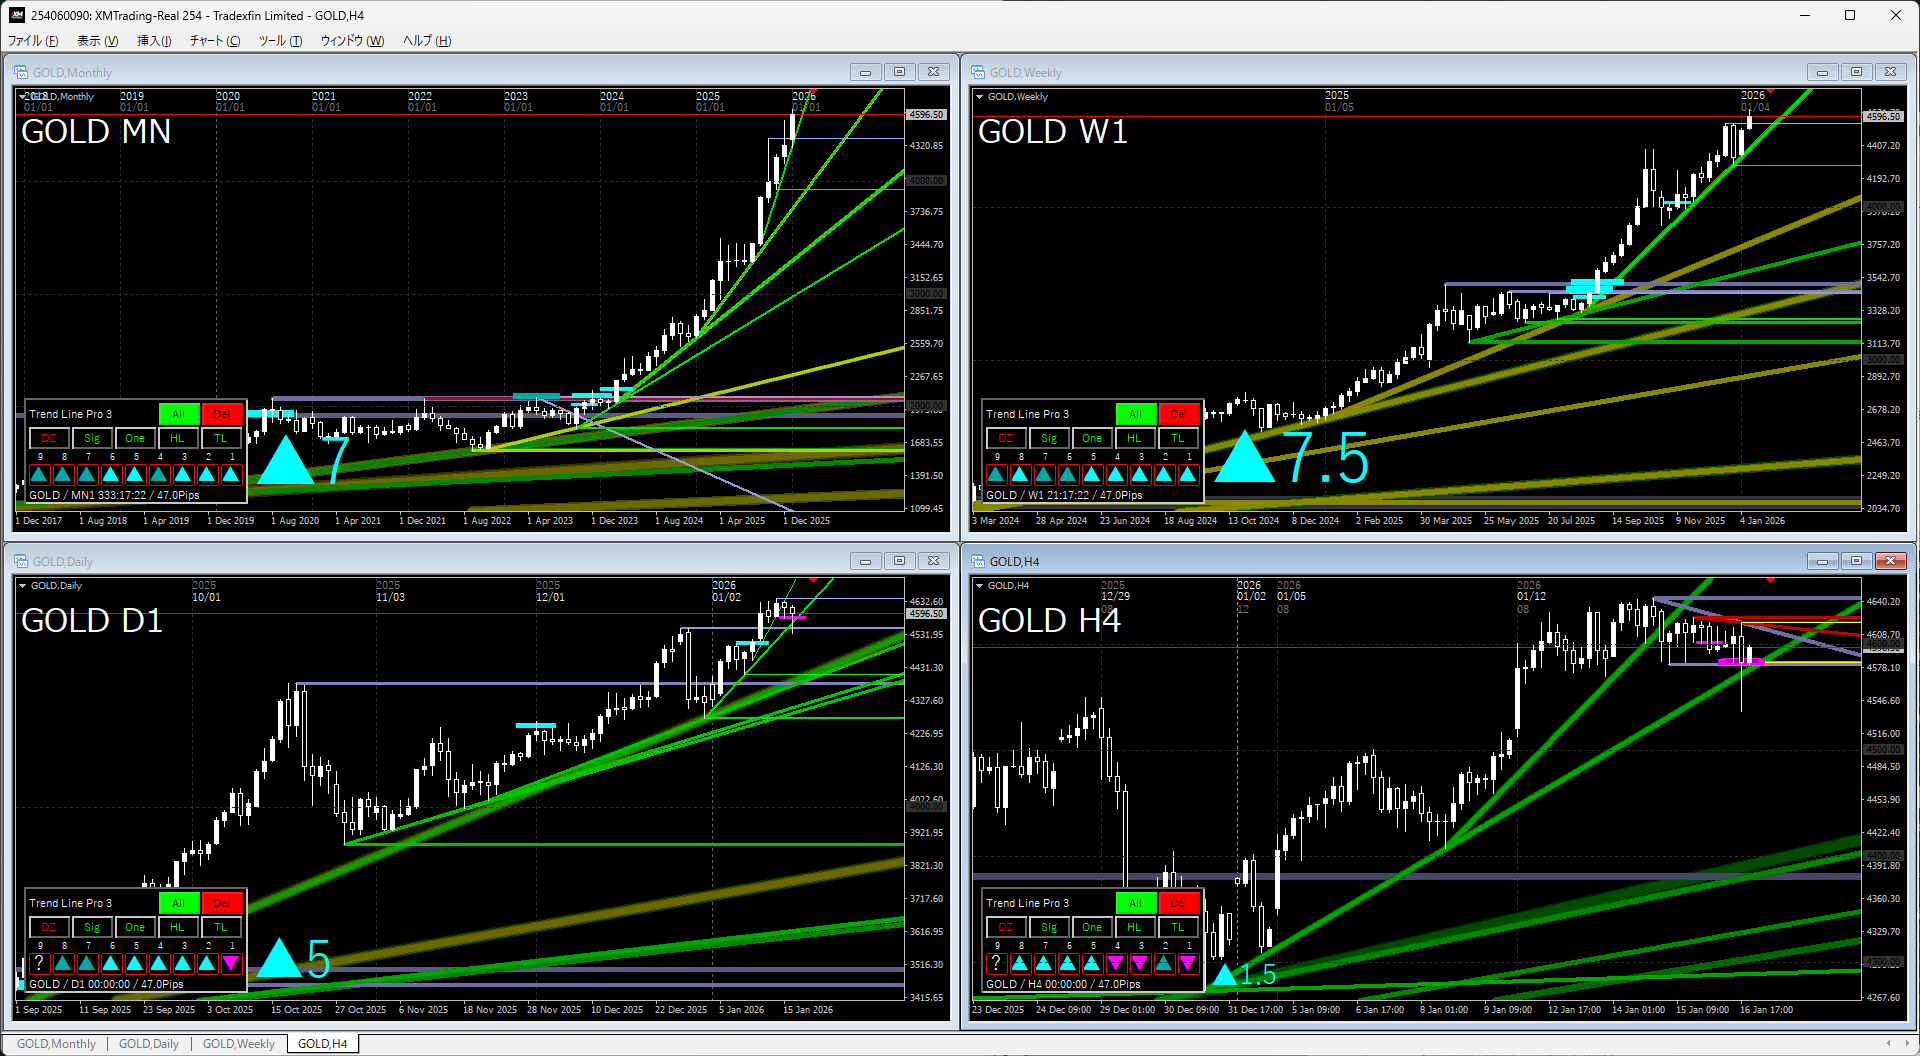
↓This week's chart↓

No change in image from last week.
Gold remains in a buy-strong stance.
This does not mean gold is rising; rather, it is widely viewed as currency values decreasing.
There are few sellers, so if it drops sharply, a waiting stance to buy may not be appropriate.
Still, it seems overheated to some extent.
S&P 500
↓Last week's chart↓
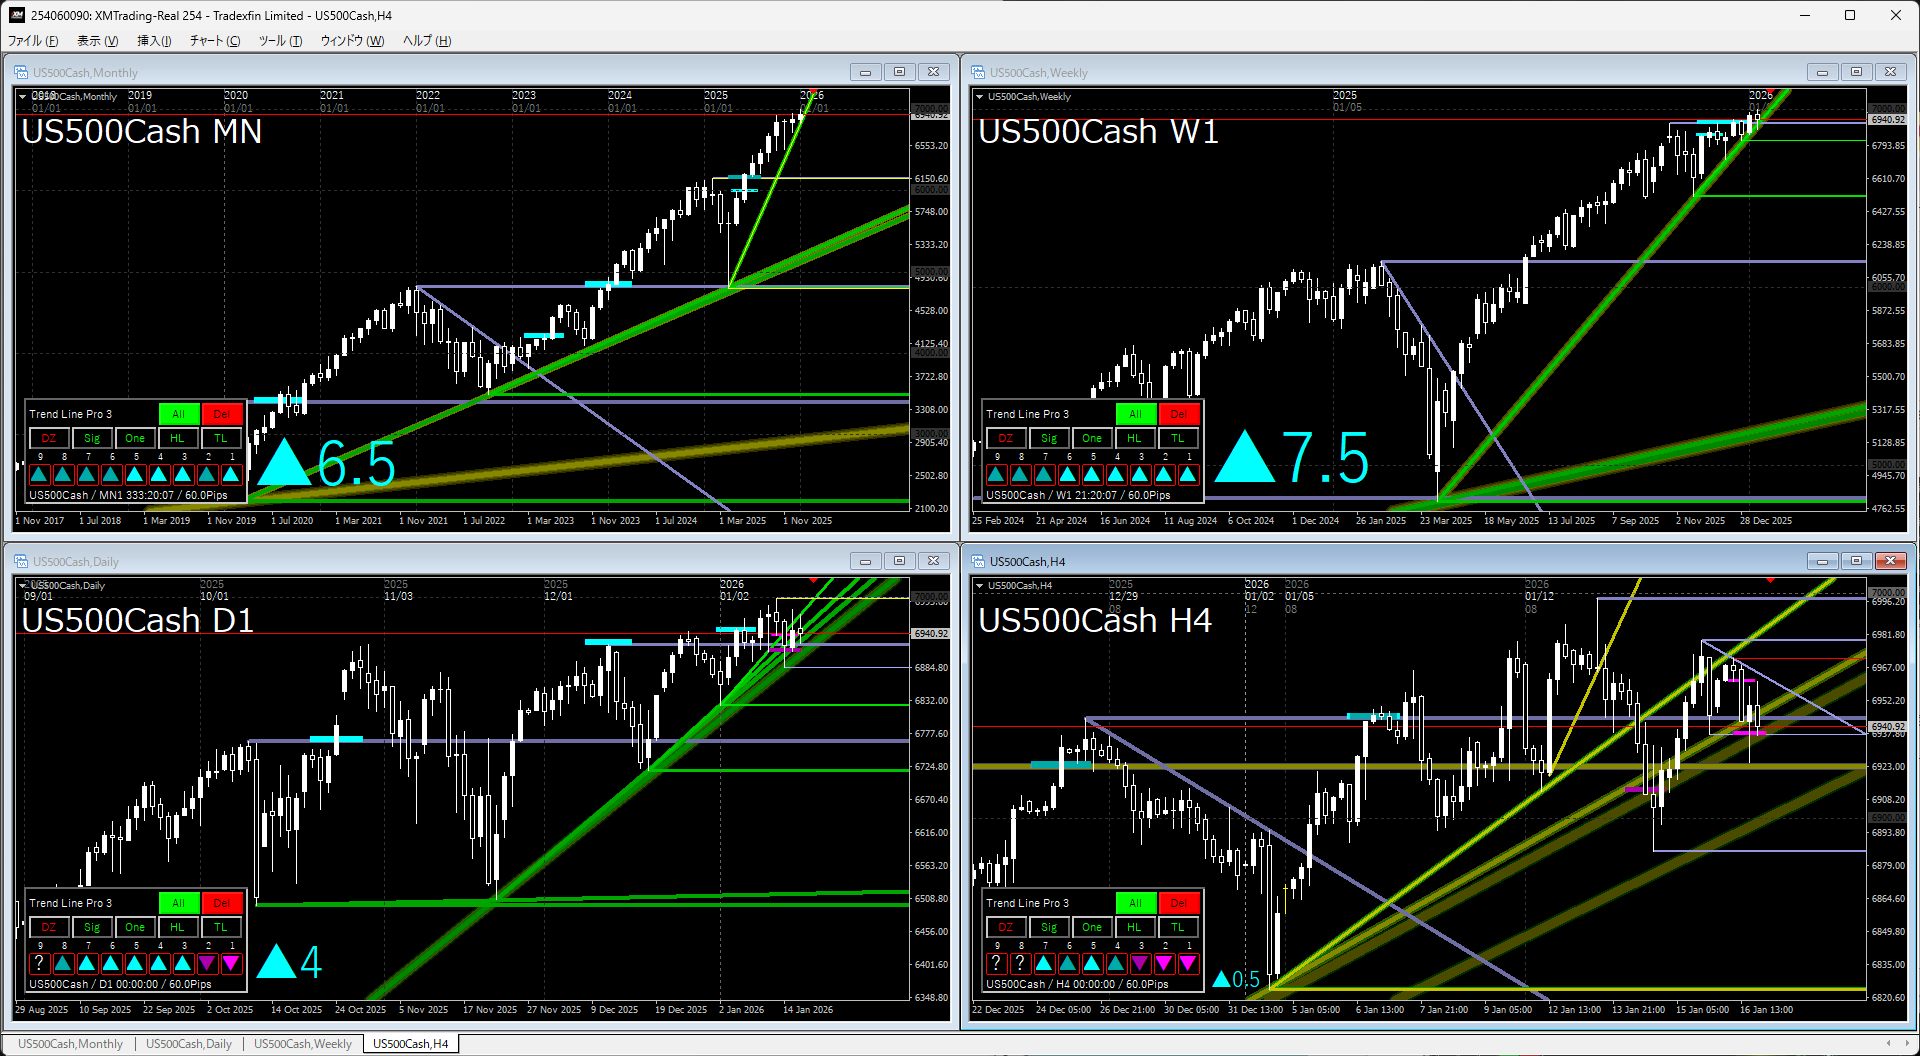
↓This week's chart↓

Monthly & WeeklyThere is no image change from last week.
It continues higher after a rebound at the trendline.
As noted in gold, many view currency value as decreasing, so the market is generally prone to rise.
Daily & 4-hourLast week, I imagined either a move up or a sideways range if nothing happened.
In the end it was sideways, but the trendline has broken, so a correction phase is likely to be focused.
I still feel the sideways trend may continue.
Nikkei 225
↓Last week's chart↓

↓This week's chart↓

Monthly & WeeklyThere is no image change from last week.
In the midst of a strong rise from a double bottom breakout.
There is an impression that the trendline is drawn neatly, so if this breaks below, a large adjustment could follow.
Daily & 4-hourLast week I imagined a temporary high rise.
Still, since the trendline is not yet cleanly broken, it is not confirmed whether it will rebound upward or enter time-based adjustment.
Long-term rise is likely, so even if the trendline breaks, the sideways possibility remains.
The indicators in the attached image use the following two indicators.
If you are interested, please take a look.
『TLP2-MA Moving Average』✖『Daw sag Break Edge 9』
If you would like to continue seeing this articlein the futurepleasepress the buttonand you will be happy.
If you have any requests such as “I want more articles like this,” please feel free to let us know.