Capture the timing for buying on dips and selling on a rebound after a line break! [Chart Sign Hunter "SRF2"]
【Chart Sign Hunter “SRF2”】
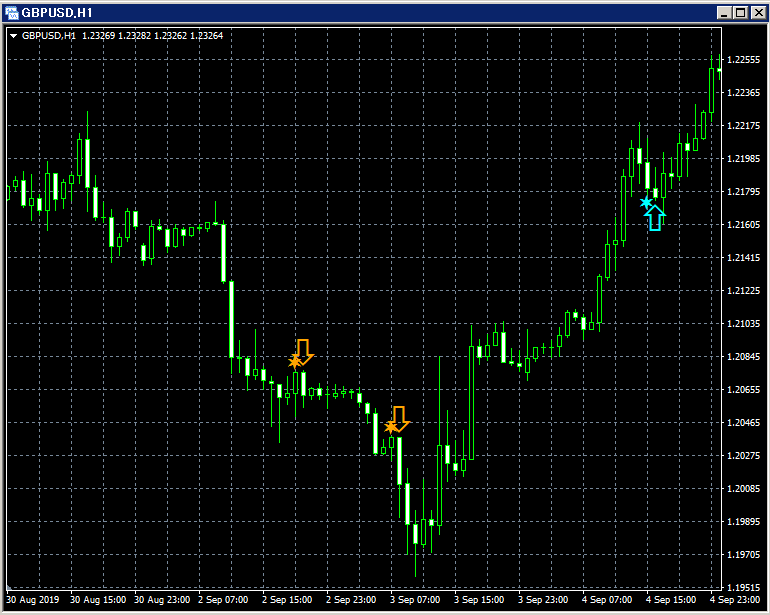
Capture the timing for pullback buying after a breakout and selling on rallies!
In the example below, the buy signal for a pullback lights up after the price breaks the previous day’s high and experiences a shallow pullback. GBPUSD 15-minute chart
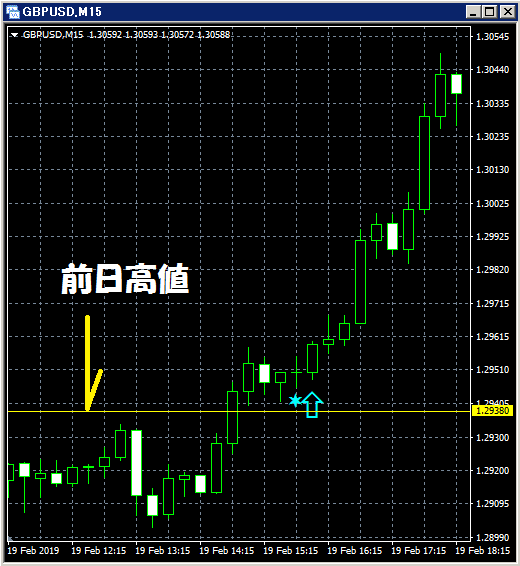
※ Please note that this indicator (SRF2) does not include any indicators that display lines such as the previous day’s high.
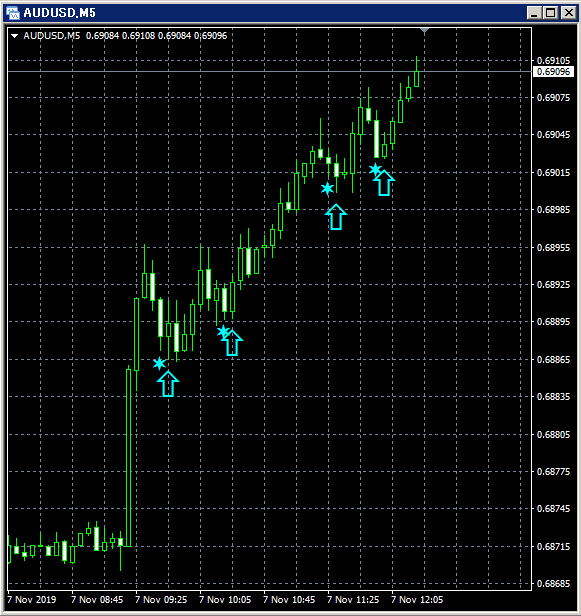
In the example below, the buy signal for a pullback lights up after breaking the most recent high and experiencing a pullback. AUDUSD 1-minute chart
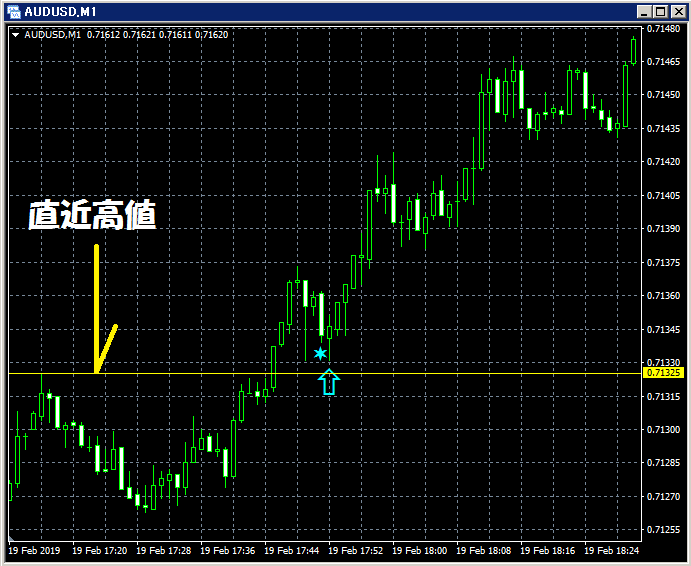
※ Please note that this indicator (SRF2) does not include any indicators that display lines such as the most recent high.
In the example below, the sell signal for a rally lights up after breaking the most recent low and a shallow retracement.
USDCAD 15-minute chart
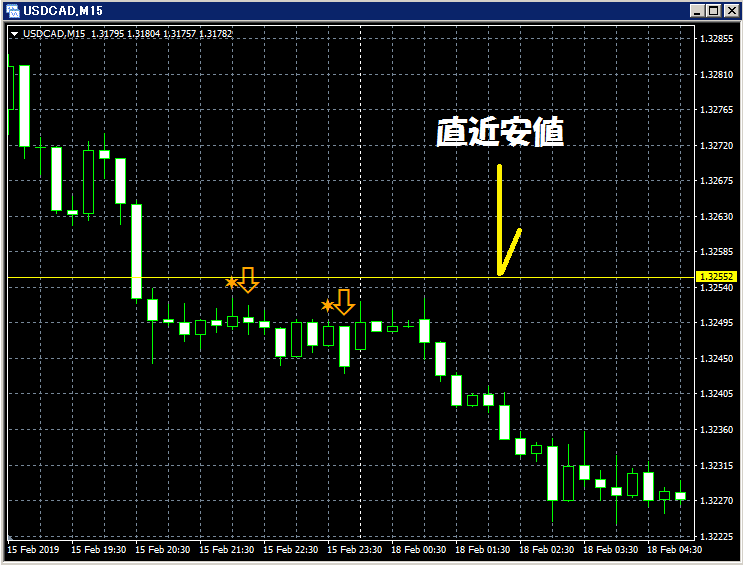
※ Please note that this indicator (SRF2) does not include any indicators that display lines such as the most recent low.
In the example below, the buy signal for a pullback lights up after breaking the previous day’s high and a shallow pullback.
EURJPY 15-minute chart
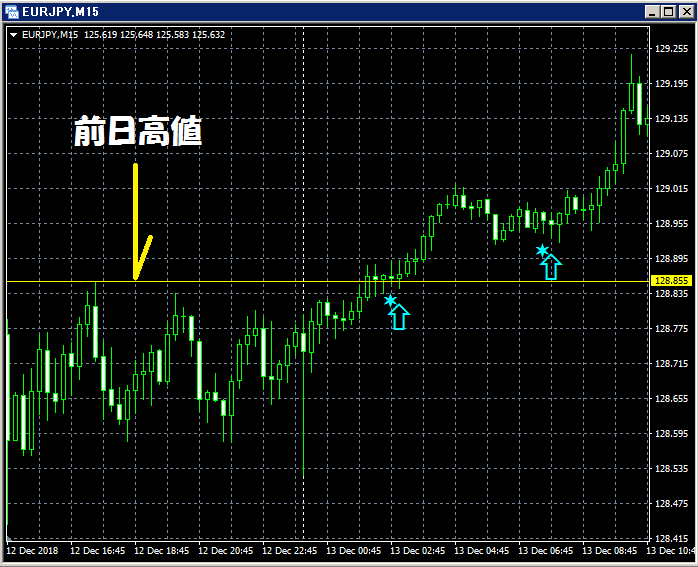
※ Please note that this indicator (SRF2) does not include any indicators that display lines such as the previous day’s high.
In the example below, the sell signal for a rally lights up after breaking the rising trendline and a retracement.
EURJPY 15-minute chart
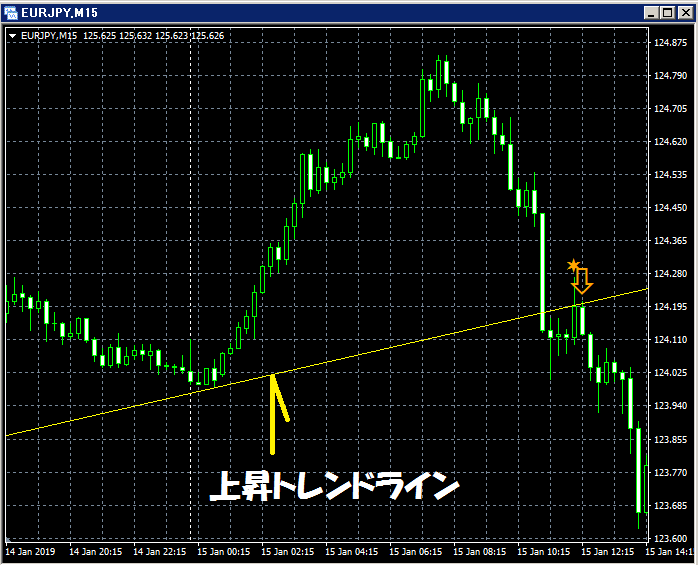
※ Please note that this indicator (SRF2) does not include any indicators that display lines such as rising trendlines.
In the example below, the sell signal for a move resumes after breaking the day’s low and the decline continues.
USDDKK 5-minute chart
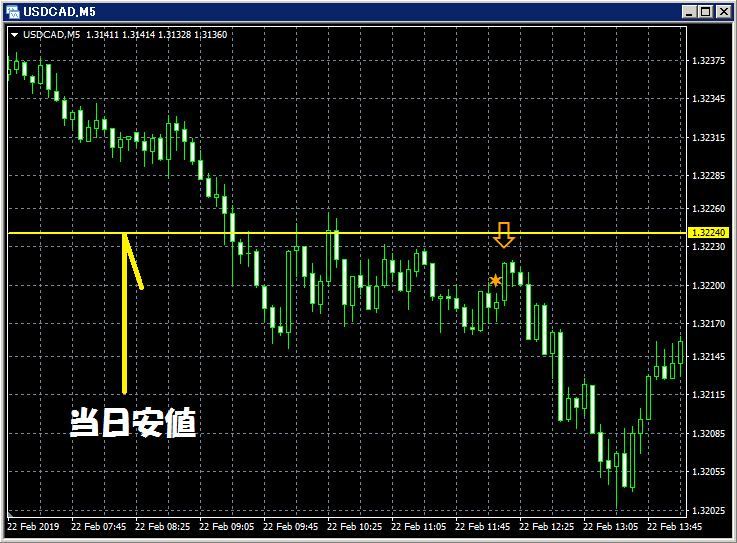
※ Please note that this indicator (SRF2) does not include any indicators that display lines such as the day’s low.
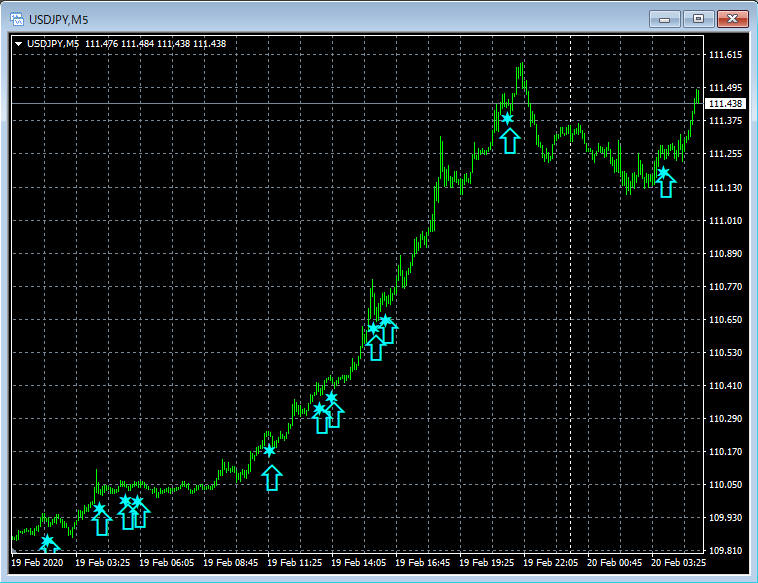
In the example below, the pullback buy signal lights up after breaking the most recent high.
NZDUSD 5-minute chart
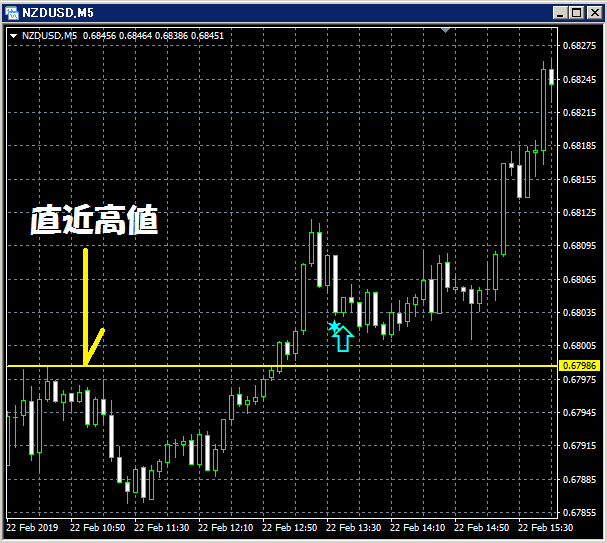
※ Please note that this indicator (SRF2) does not include any indicators that display lines such as the most recent high.
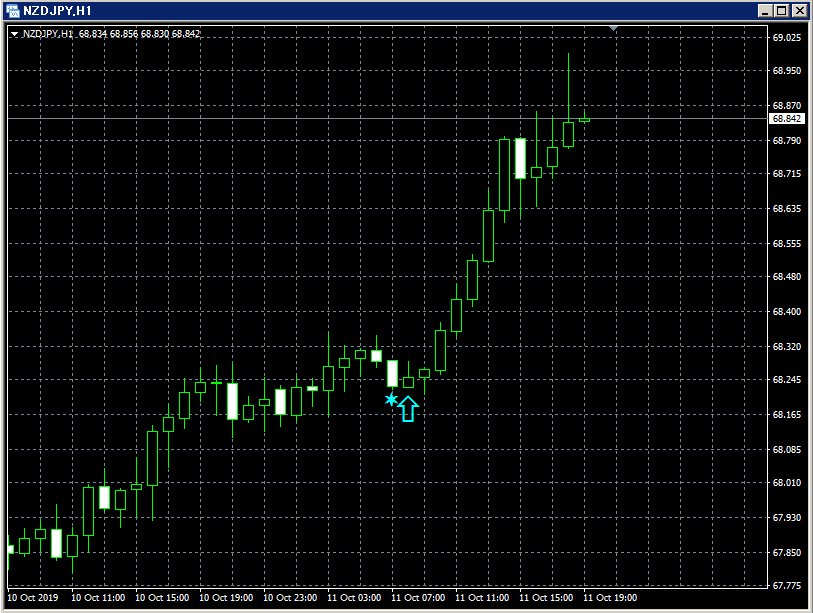
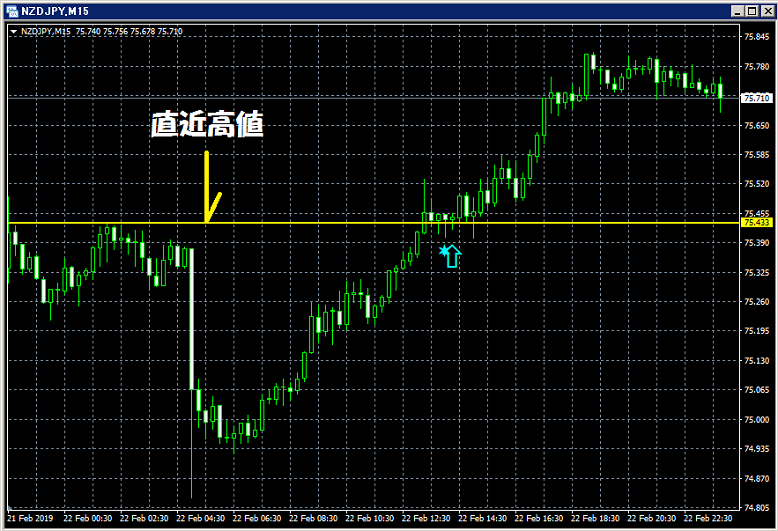
In the example below, the sell signal for a retracement lights up after breaking the most recent low.
NZDJPY 15-minute chart
※ Please note that this indicator (SRF2) does not include any indicators that display lines such as the most recent low.
In the example below, the sell signal lights up after the breakout of the rising trendline and the retracement.
USDJPY 1-minute chart
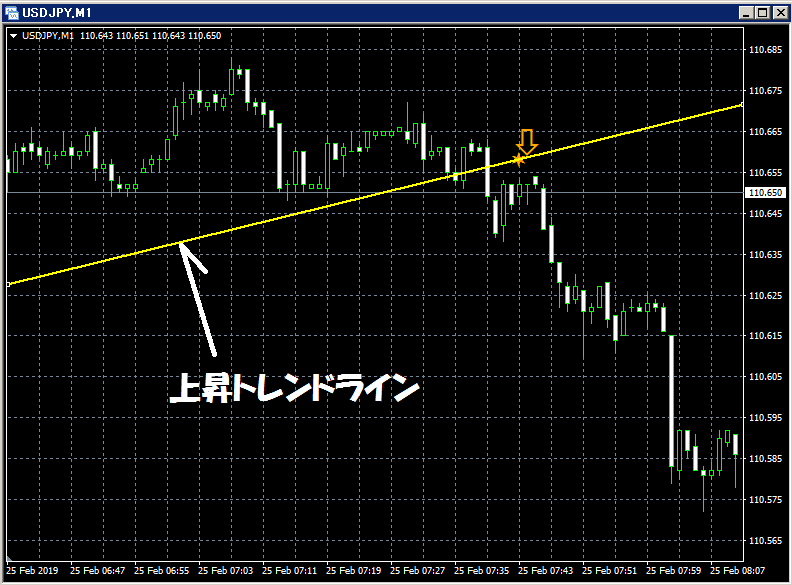
※ Please note that this indicator (SRF2) does not include any indicators that display lines such as rising trendlines.
【Chart Sign Hunter “SRF2”】
Capture the timing for pullback buying after a breakout and selling on rallies!