

【BTCJPY】20190306 Daily Pivot
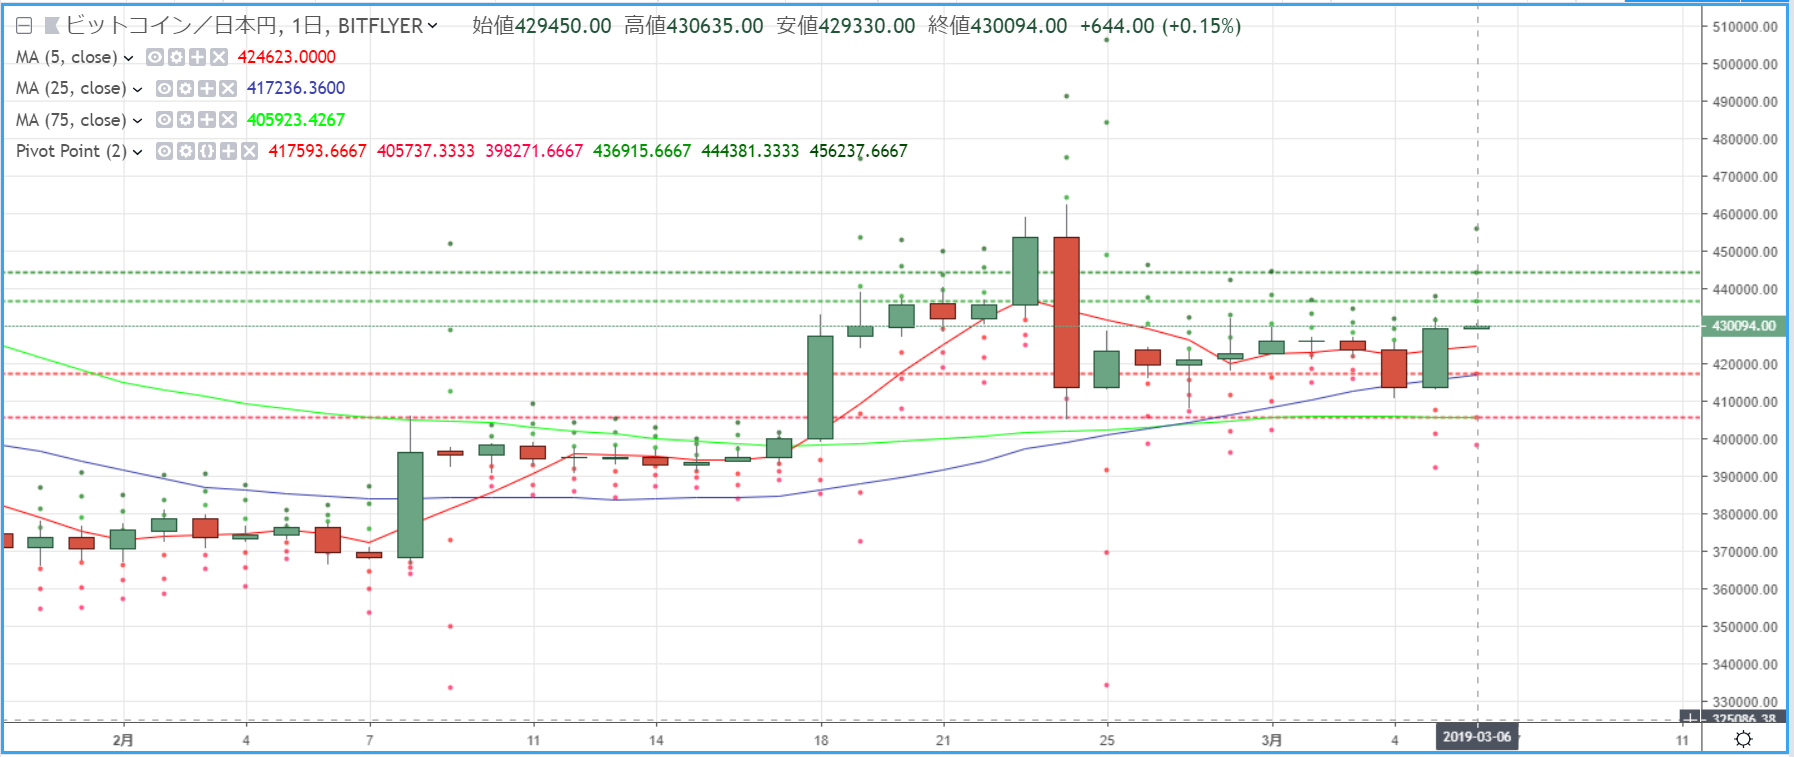
R2=444,381
R1=436,915
S1=417,593
S2=405,737
※ Pivot points are technical indicators used to forecast price movements for the day based on the previous day's trading range. Centered on the Pivot Point (PP), draw resistance lines (R1, R2) above and below, and support lines (S1, S2) below, using them as trading references.
【Calculation Method】
Pivot Point (PP) = (Prev Day Close + Prev Day High + Prev Day Low) / 3
Resistance Line 1 (R1) = PP + (PP - Prev Day Low)
Support Line 1 (S1) = PP - (Prev Day High - PP)
Resistance Line 2 (R2) = PP + (Prev Day High - Prev Day Low)
Support Line 2 (S2) = PP - (Prev Day High - Prev Day Low)


