Chart Sign Hunter "SRF2" Sell signal in AUDUSD on a pullback 2019/2/28
Yesterday (February 28, 2019) in the AUDUSD 1-hour chart, there was a sharp decline after breaking below the previous day's low, as shown in the figure below.
AUDUSD 1-hour chart
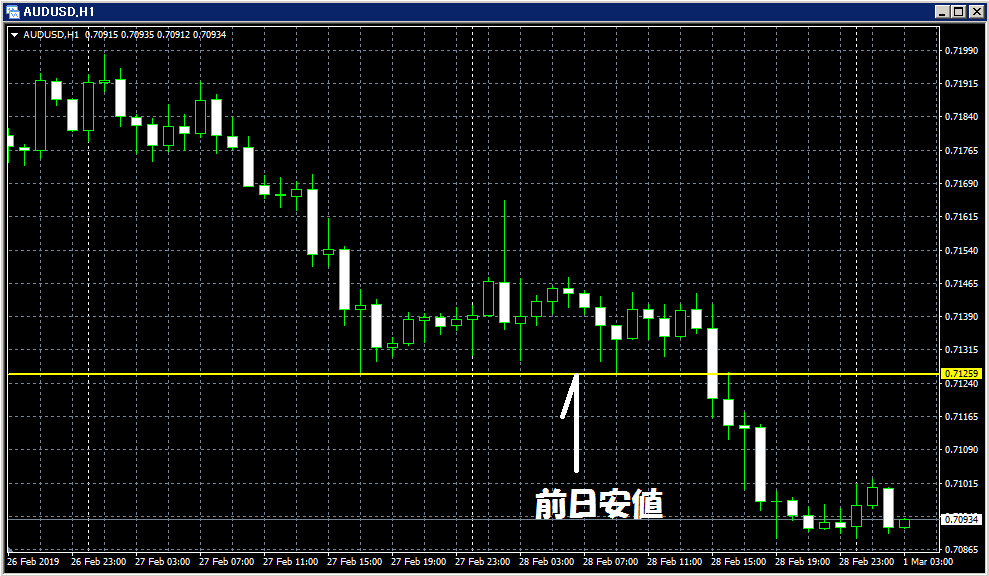
Note: This indicator (SRF2) does not come with an indicator that displays lines such as the previous day's low, so please be aware.
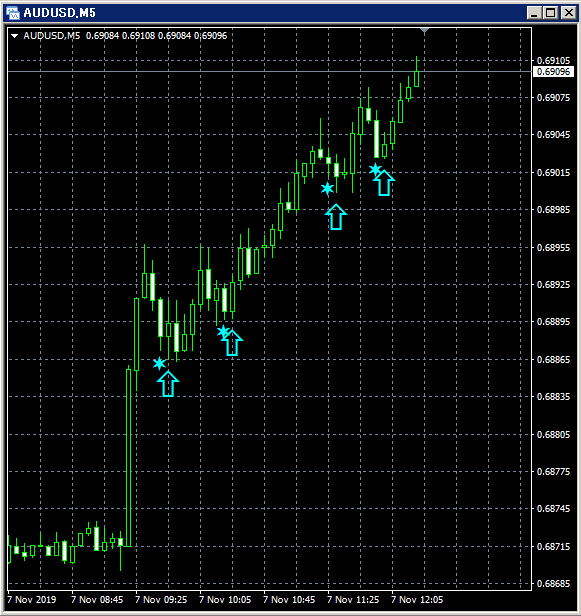
As seen in the figure below when looking at the 1-minute chart, after breaking the previous day's low and making a new swing low, there is a shallow pullback where the SRF2 reversal signal lights up. Subsequently, the price continues to fall smoothly.SRF2 reversal signal is illuminated the price
AUDUSD 1-minute chart (February 28, 2019)
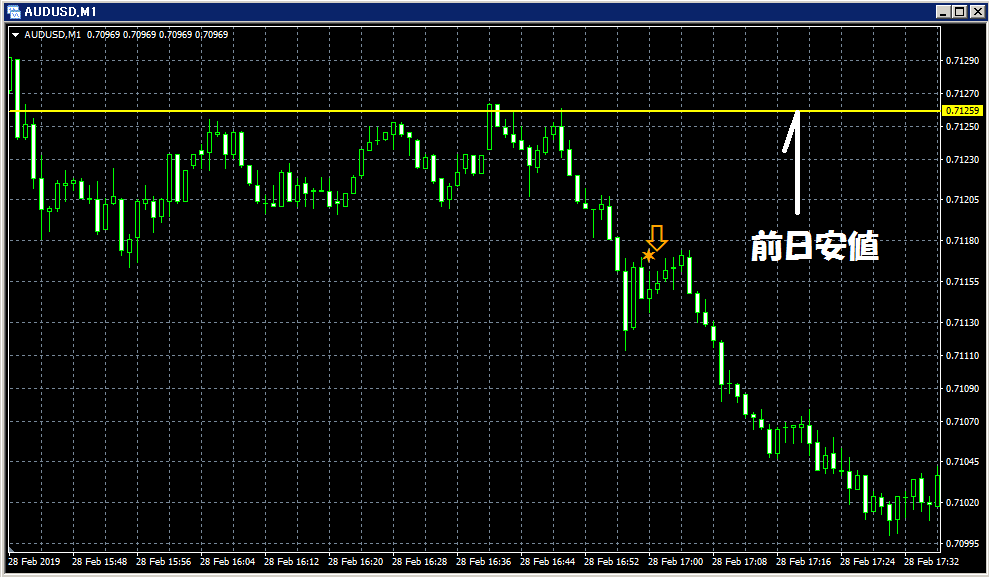
Note: This indicator (SRF2) does not come with an indicator that displays lines such as the previous day's low, so please be aware.
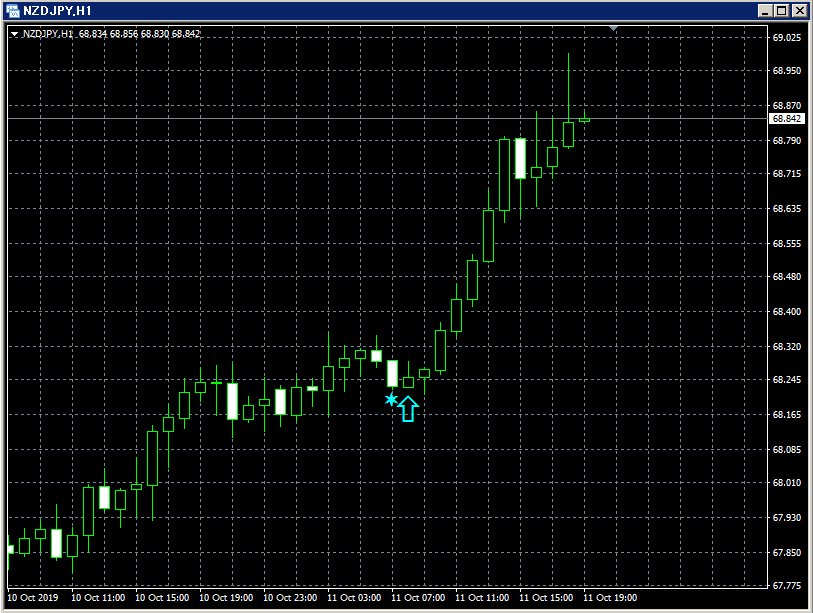
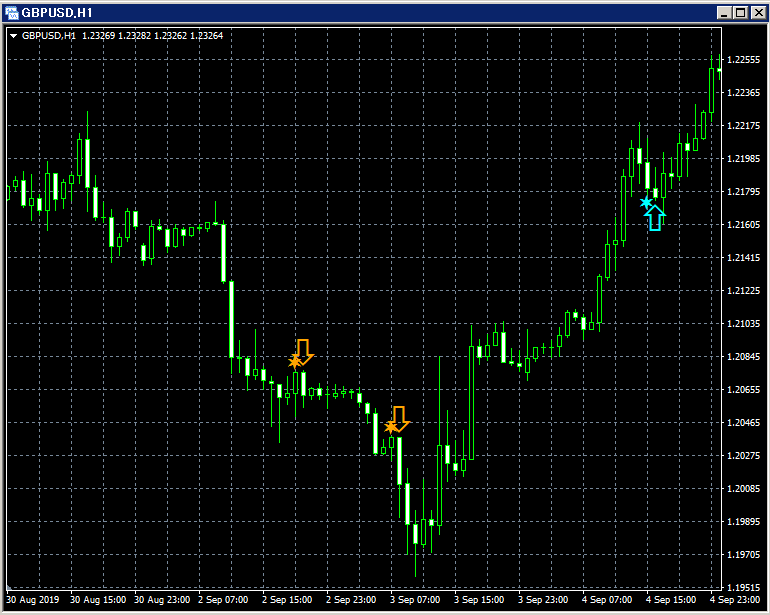
[Chart Sign Hunter "SRF2"]
During rapid rises and falls or strong trend periods, where oscillators may have difficulty capturing
shallow pullbacks and rallies, aiming to buy on dips and sell on rallies