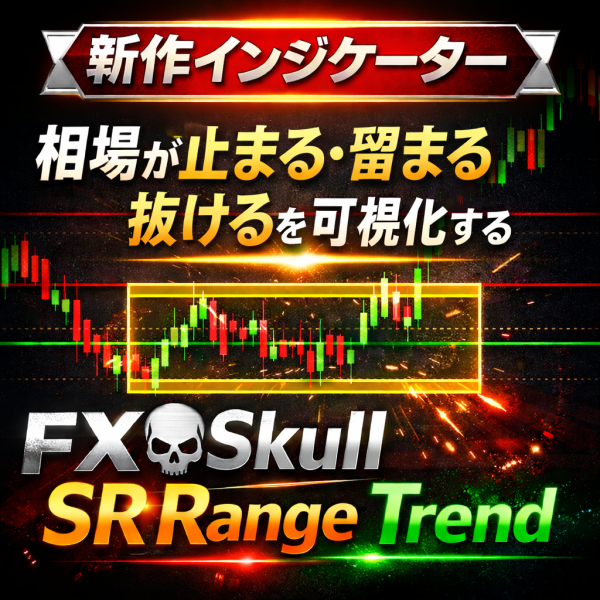

【New Indicator】Visualize when the market stops, accumulates, or breaks out
The market’s "stopping, accumulating, breaking out" at a glance
A new situational awareness to grasp instantly
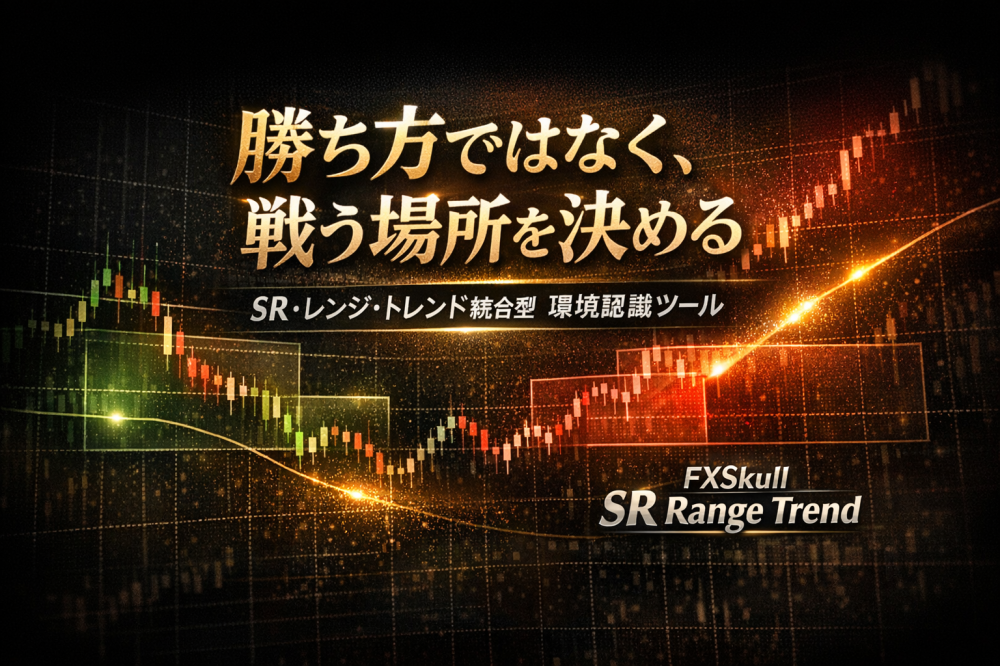
Not about how to win,but where to fight
SR・Range・Trend integrated tool
FXSkull SR Range Trend
The market may seem to be moving all the time, butit actually repeats these three: “stopping,” “accumulating,” and “breaking out.”
Many traders lose not because of methods or logic, but because they misidentify“whether this is the market to fight right now.”
is not a tool that gives entry signals. It is a dedicated environmental perception tool to visually determinewhat state the current market is inthe current directional pressure.
- You don’t realize you’re in a range and end up with unnecessary entries
- You think it’s a trend, but it immediately reverses
- Although SR is drawn, you don’t know if it’s actually working now
If any of these apply,you may simply be misjudging the market environment
What can be seen with this tool
FXSkull SR Range Trend does notpredict the market direction,but visualizes.
What aids judgment is thecolor of lines, their count, and the range boxes shown on the chart
Line color reveals “directional pressure”
- Many lime lines→ Upward pressure is strong, indicating a bullish trend
- Many red lines→ Downward pressure is strong, indicating a bearish trend
By looking at the bias in both the count and color, you canvisually grasp which way the market is leaningwithout relying on feel.
“Stop/Accumulation” zones shown by Range Boxes
In areas where multiple SRs are competing and prices alternate, it is displayed as aRange Box.
- Areas where prices tend to pause
- Areas where energy is accumulating
- When price breaks out, the next trend tends to form in that direction
With Range Boxes, you can calmly determine whether
Capture the same time-frame flow by zooming out
The zoom-out in FXSkull SR Range Trend is not for switching to a higher timeframe.
Keep the same timeframe and broaden your viewto grasp the major flow and directional bias at that timeframe.
Trade results are almost decided before you enter.Not about how to win,
butwhich market to trade in.
FXSkull SR Range Trend isa market map for making such judgments visually
When situational awareness changes, the quality of trading certainly changes.
Details here