Chart Sign Hunter "SRF2" Buy-the-dip signal for USD/JPY 2019/2/27
The 15-minute USD/JPY chart from the day before yesterday (February 27, 2019) shows a scenario where, after being supported near the daily EMA 21 as indicated in the figure below, it broke above the downward trendline and surged sharply.
USD/JPY 15-minute chart (February 27, 2019)
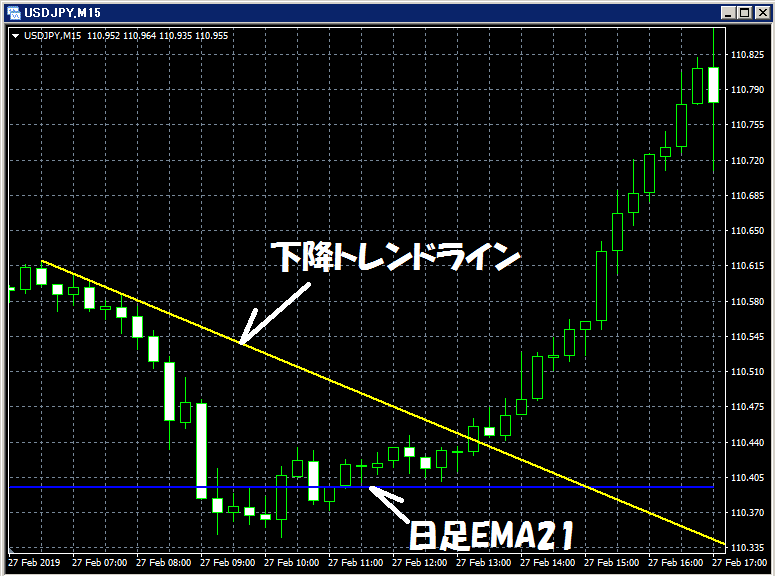
Please note that this indicator (SRF2) does not include indicators that display lines such as a trendline or the daily EMA21 on the 15-minute chart.
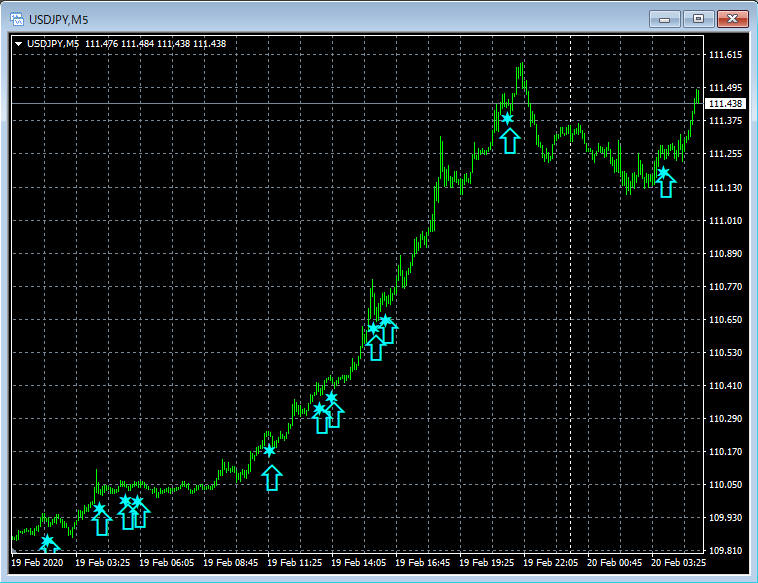
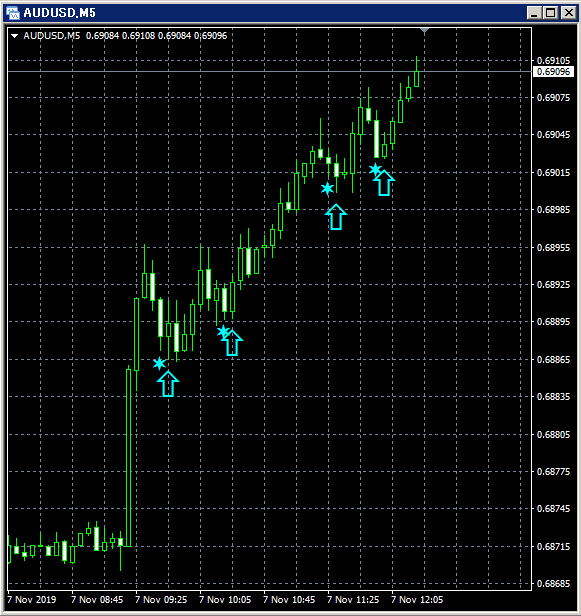
As you can see in the figure below when looking at the 5-minute chart, after breaking above the downward trendline and recent highs, there is a shallow pullback that lights up SRF2's buy-the-dip signal. Subsequently, the price continues to rise smoothly.
USD/JPY 5-minute chart (February 27, 2019)
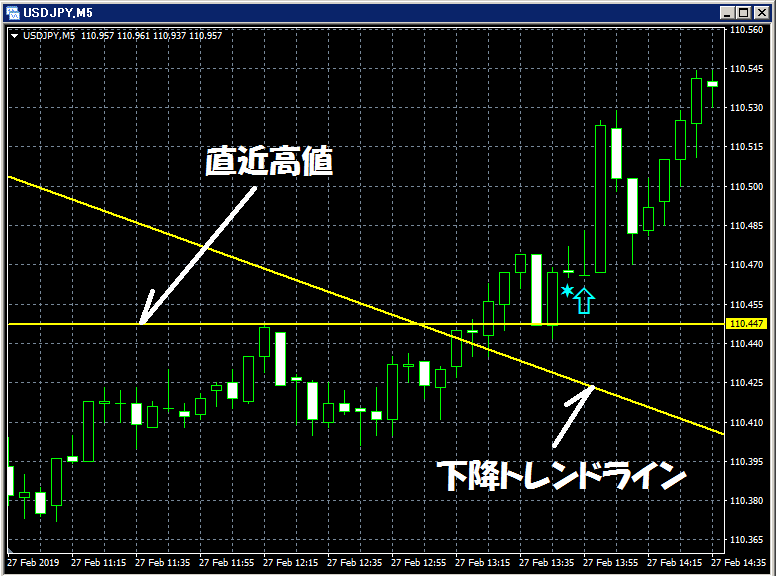
Please note that this indicator (SRF2) does not include indicators that display lines such as a trendline or recent highs, so caution is advised.
[Chart Sign Hunter "SRF2"]
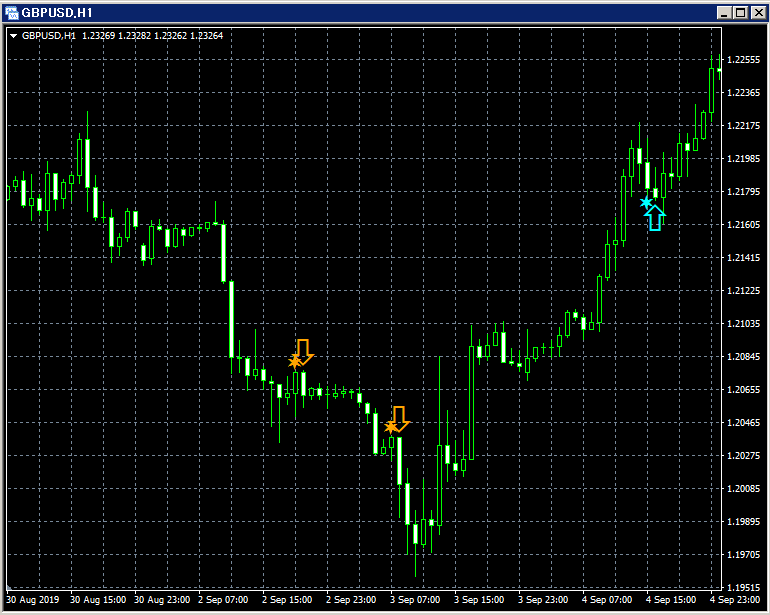
During sharp surges or declines and during strong trending moves, the oscillator may be difficult to capture
the shallow pullbacks or retracements to aim for dip buying or pullback selling