

Resistance zone that repeatedly rebounds at monthly level
Hello!
I am Satori, researching Binary & FX.
Today I will deliver a piece on “resistance zones that repeatedly bounce at the monthly level.”
The figure below shows a powerful resistance zone in the USD/JPY monthly chart that has bounced many times.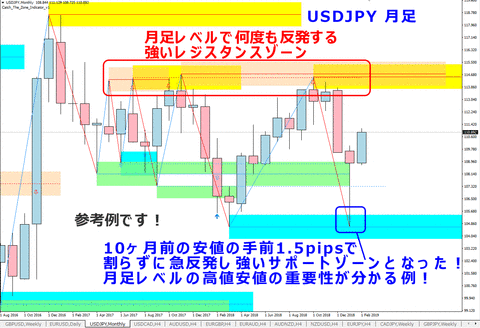
http://livedoor.blogimg.jp/fxmt4indicator/imgs/1/4/145a7d99.gif
In the above chart, the yellow and beige bands overlap around 114.50, where for two years it has rebounded downward five times and been held down.
As for the lows, during the sharp drop in January 2019, it sharply reversed without cutting the previous low of 104.631 from ten months earlier by a 1.5-pip gap, forming a long lower shadow as well.
You can understand how the high and low at the monthly level are being watched.
We cannot wait ten months for entry, but phenomena and chart patterns at the monthly to 1-minute levels appear in the market likewise.
This is generally similar to what is called fractal structure.
The appearance of zones for highs and lows or chart patterns is influenced by human psychology, so in any market and at any era it will be conscious, and the key is how to use this.
Reference video.
Overview video of Catch The Zone Indicator
https://youtu.be/90s9_PfjTpw
The indicators used today are as follows.
**************************************************************
Catch The Zone Indicator
http://fxmt4indicator.abproducts.biz/wp/?page_id=3173
Capture highs and lows with zones to signal, email, and alert!
***************************************************************
Thank you very much for reading up to here today.
Technical Trading Blog Ranking
* For free newsletter “Research on Binary & FX,” please register at the URL below.


