Chart Sign Hunter "SRF2" Buy-the-Dip Signal in Pound-Dollar 2019/2/27
In yesterday's 15-minute pound-dollar chart (February 27, 2019), as shown below, there was a scenario where the downward trend line was breached to resume the rise.
Pound-Dollar 15-minute chart (February 27, 2019)
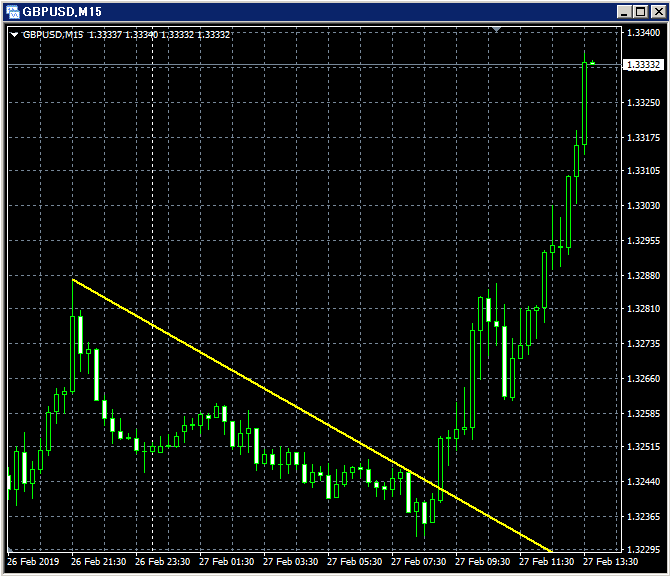
*Please note that this indicator (SRF2) does not include indicators that display trend lines, etc.
If you look at the 1-minute chart as shown below, after the breakout above the downward trend line, the SRF2 pullback-buy signal lights up. Subsequently, the price rises smoothly.
Pound-Dollar 1-minute chart (February 27, 2019)
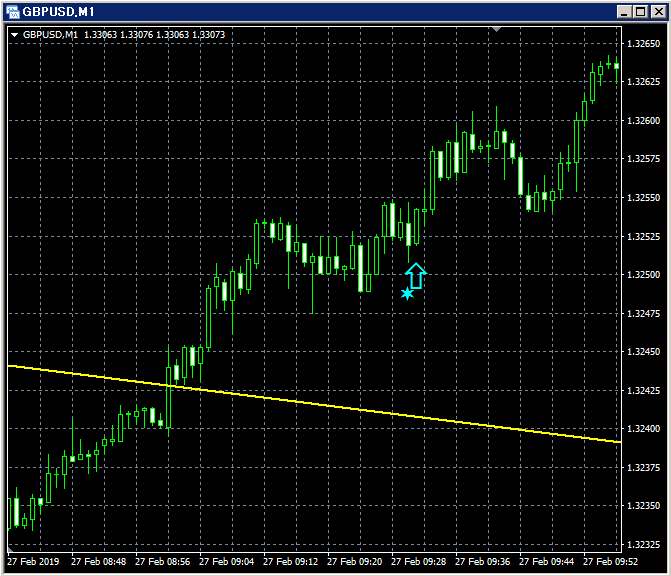
*Please note that this indicator (SRF2) does not include indicators that display trend lines, etc.
[Chart Sign Hunter “SRF2”]
During sharp rises and falls or when a strong trend occurs, the oscillator may find it difficult to capture
by aiming for pullbacks/breakouts with shallow pullbacks