Chart Sign Hunter "SRF2" Retracement Sell Signal in USD/JPY 2019/2/27
In the 15-minute USD/JPY example below, after breaking below the upward trend line,SRF2 gives a pullback sell signal, and the price is steadily declining.
USD/JPY 15-minute chart (February 27, 2019)
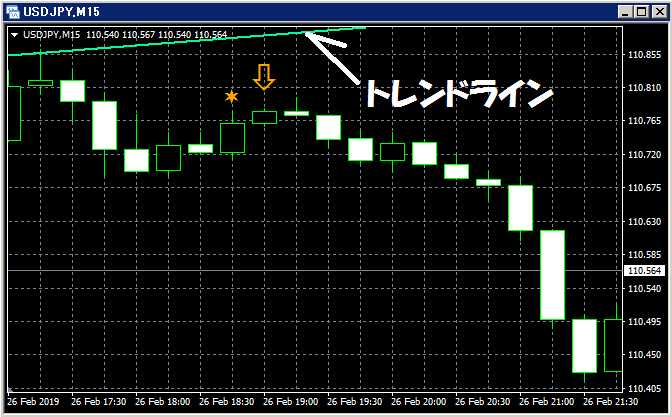
Please note that this indicator (SRF2) does not include any indicators that display trend lines, etc.
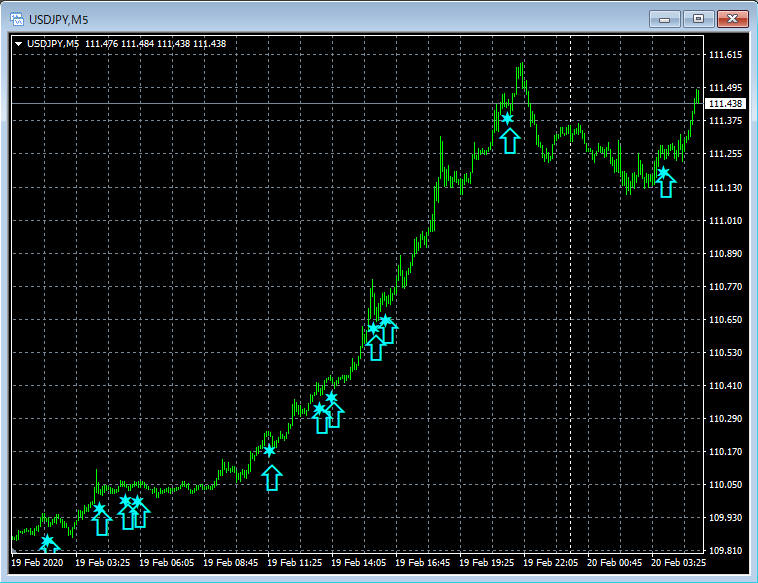
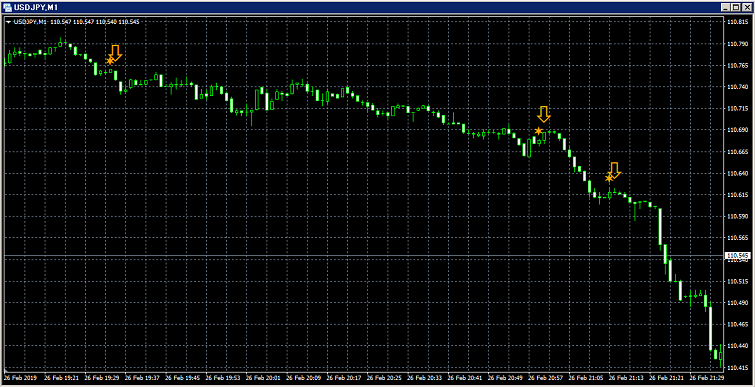
After the pullback sell signal lights up on the USD/JPY 15-minute chart, on the 1-minute chart as shown below,SRF2 pullback sell signals light up several times and the price declines steadily. USD/JPY 1-minute chart (February 27, 2019)
[Chart Sign Hunter “SRF2”]
During sharp rises and falls or when a strong trend occurs, the oscillator may have difficulty capturing
shallow pullbacks where you can target dips for buying and pullbacks for selling
× ![]()