

December 19 (Fri): 【Harmonic】 Nikkei 225 vs. GOLD
[Note]
I don’t know what will happen in the year-end and New Year market.
Trade with ample margins!
At the beginning of 2019“Flash Crash”occurred.
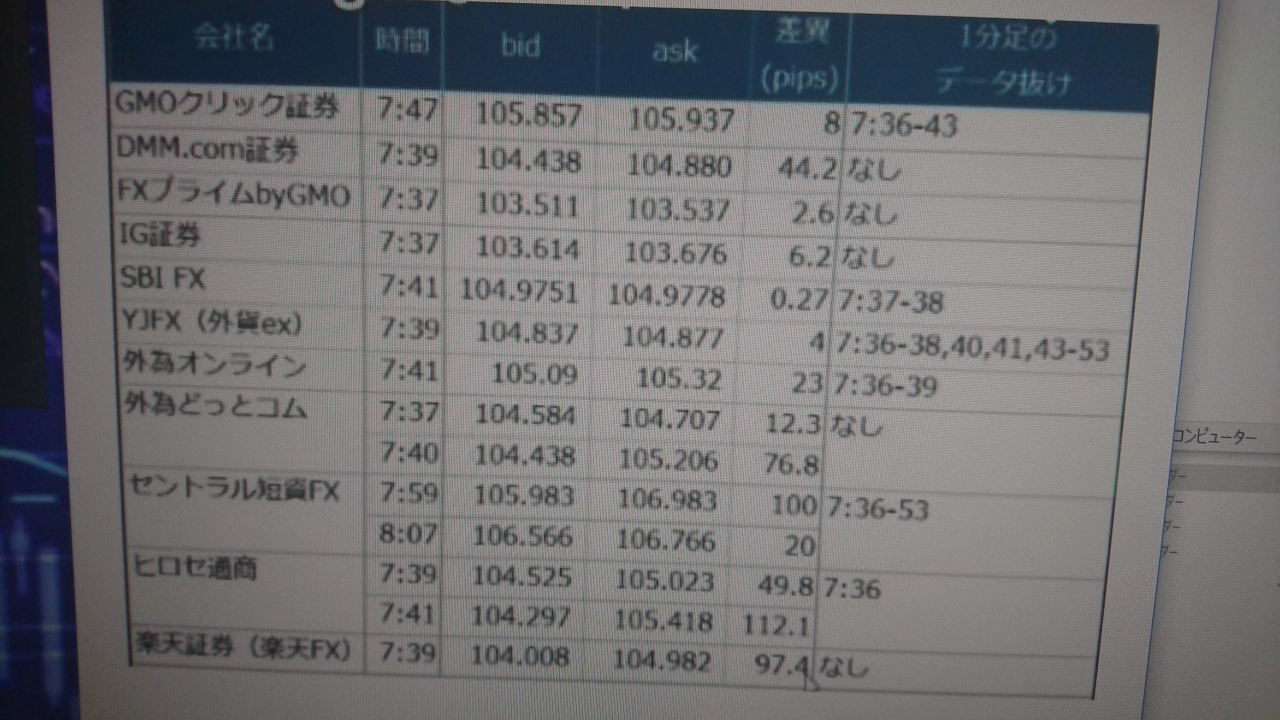
As you can see in the figure below,
there were brokers with spreads widening to 100 pips, leading to a massacre of margin calls and variation margin.
This is why many investors recommend closing positions by year-end.
Basically, I also avoid holding positions during year-end and New Year, or if I do hold them, I reduce their size to mitigate risk.
Please keep in mind that something like this can happen!
history tends to repeat itself...
[Anomaly]
“Dawn, Noon decline, 未辛耐 (not patient), monkey, dog laugh, boar hardening, rat prosper, ox stumble, tiger runs a thousand leagues, rabbit jumps”
It is said.
Next year is…“Noon decline”
Therefore there is a possibility the market will fade...
In fact, next year’s “Year of the Horse”“Bing-Wu (iron fire horse)”is.
Even in the Year of the Horse, the year of Bing-Wu can see markets ignite rapidly.
However, even if it ignites, it can also extinguish quickly, so a rapid rise followed by a sharp fall is possible, which could result in a “Noon decline.”
An anomaly with a somewhat predictable tendency.
Please also remember this! (*^^)v
This time
generally said to be inversely correlated with stock prices
GOLD
will be compared.
[Overall Scenario Probability]
This week's overall market is…
“Up: 45% / Down: 55%”
※ Downside cautious with adjustments included
※ Presented as a reference level.
[This Week’s Market Focus Points]
This week, we are focusing on price action at key levels for the Nikkei 225 and GOLD.
For the Nikkei 225, at a 〖daily chart〗 Gartley pattern, the key point is whether the price moves down again while aiming for the PRZ.
On the other hand, for GOLD, at a 〖4-hour chart〗 Butterfly pattern has reached the PRZ; the question is whether it will simply reverse downward, or if buying near the most critical levels within the PRZ will continue, which is a point of judgment.
Considering the inverse correlation with the U.S. 10-year yield, GOLD’s moves tend to affect other markets as well.
In the paid section, we also explain in detail how to view each time frame and cases where you should refrain from entering.
➥The rest is explained in detail in the members-only report.
If you are not registered yet, please click here ↓
● Try daily chart analysis using “The Unraveling of Bollinger Bands”
https://www.gogojungle.co.jp/finance/navi/series/1613?via=articles_detail_aside
● Use “The Prescription of Harmonics” to draw a “Chart should stop at a point”Zone!https://www.gogojungle.co.jp/finance/navi/series/1668?via=articles_detail_aside
(※Below is for members only.)


