

December 19 (Fri): [Bollinger Bands] Nikkei 225 vs. GOLD
[Note]
I don’t know what will happen in the market at year-end and New Year.
Trade with plenty of room to maneuver!
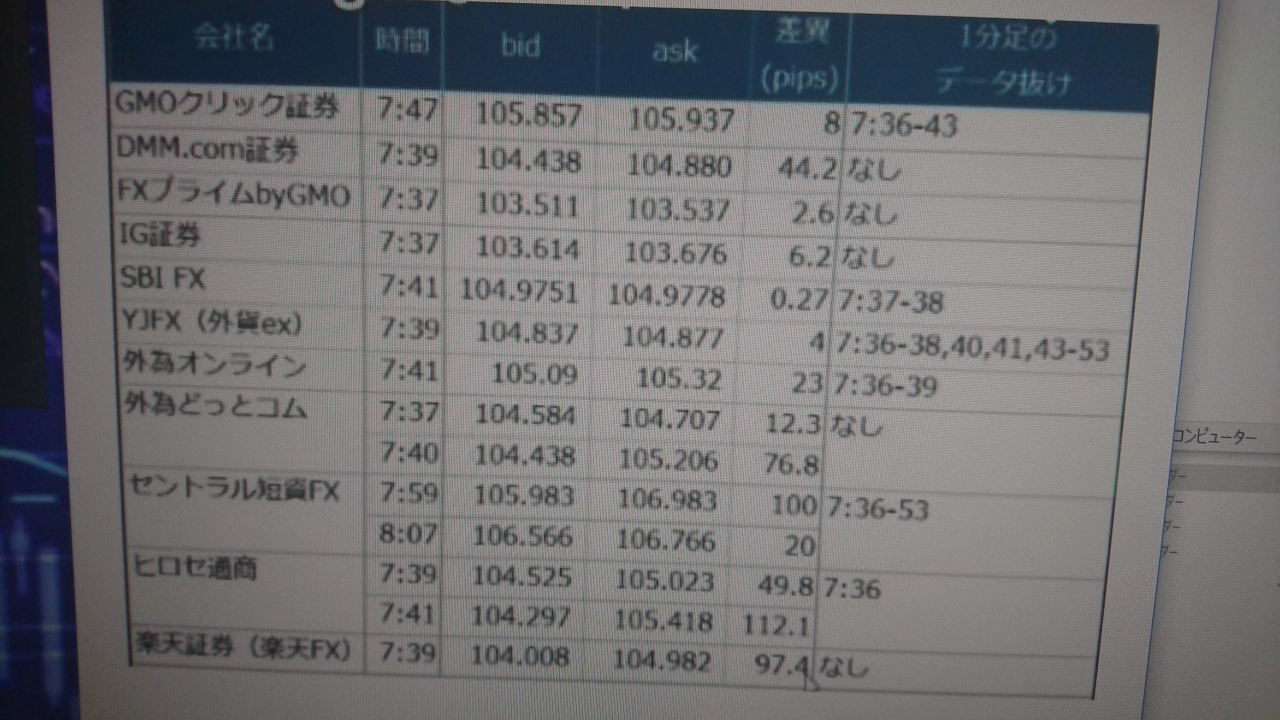
At the beginning of 2019,'Flash Crash'occurred.
As you can see in the figure below,
some brokers had spreads widen to 100 pips, leading to a massacre of stop-outs and margin calls.
Many investors recommend closing positions toward the end of the year for this reason.
Basically, I also avoid holding positions during year-end and New Year, or if I do, I reduce their size as a precaution.
Please keep in mind that this kind of thing can happen!
The times repeat themselves, after all…
【Anomalies】
'辰巳天井、午尻下がり、未辛抱、申酉騒ぐ、戌笑い、亥固まる、子は 繁栄、丑つまずき、寅千里を走り、卯は跳ねる'
It is said.
Next year is…'午尻下がり'
Thus the market may lose steam, but…
In fact, next year’s “Year of the Horse” is"Bing-Wu (bing wu)".
Even in a Year of the Horse, the market can surge dramatically, but it can also burn out quickly, leading to sharp rises followed by sharp drops, so the result could be a descent like '午尻下がり'...
Anomalies are tendencies that seem to occur.
Please remember this too! (*^^)v
This time
generally compared with
'GOLD'
which is said to be inversely correlated with stock prices.
【Overall Scenario Probability】
This week's overall market is…
"Up: 45% / Down: 55%"
【This Week’s Market Focus Points】
This week we focus on the contrasting price movements of GOLD and the Nikkei 225.
GOLD has been in a【monthly-to-daily】trend channel state, with a sideways trend and time adjustment (blue zone) expected to resume higher.
On the other hand, the Nikkei 225 daily chart is positioned at an important ‘turning point’ sandwiched between a -2σ near-value Pin-bar and a declining moving average, so movement up or down could happen unexpectedly.
Considering correlation, if GOLD continues to rise, the stock market may enter a time-based adjustment phase.
In the paid section, we detail the scenario branches and cautions for each time frame.
➥The continuation is explained in detail in a members-only report.
If you are not registered yet, please click here ↓
●'Disassembling the Bollinger Bands' to analyze daily charts
https://www.gogojungle.co.jp/finance/navi/series/1613?via=articles_detail_aside
●'Harmonic Prescriptions' to draw 'the chart should stop at the point where it should stop'Zone!https://www.gogojungle.co.jp/finance/navi/series/1668?via=articles_detail_aside
(※Below this, access is limited to members.”)


