

December 18 (Thu): [Harmonic] Nikkei 225 vs US 10-Year Treasury Yield
[Note]
I don’t know what will happen in the year-end and New Year market.
Let’s trade with enough margin!
At the beginning of 2019“Flash Crash”happened.
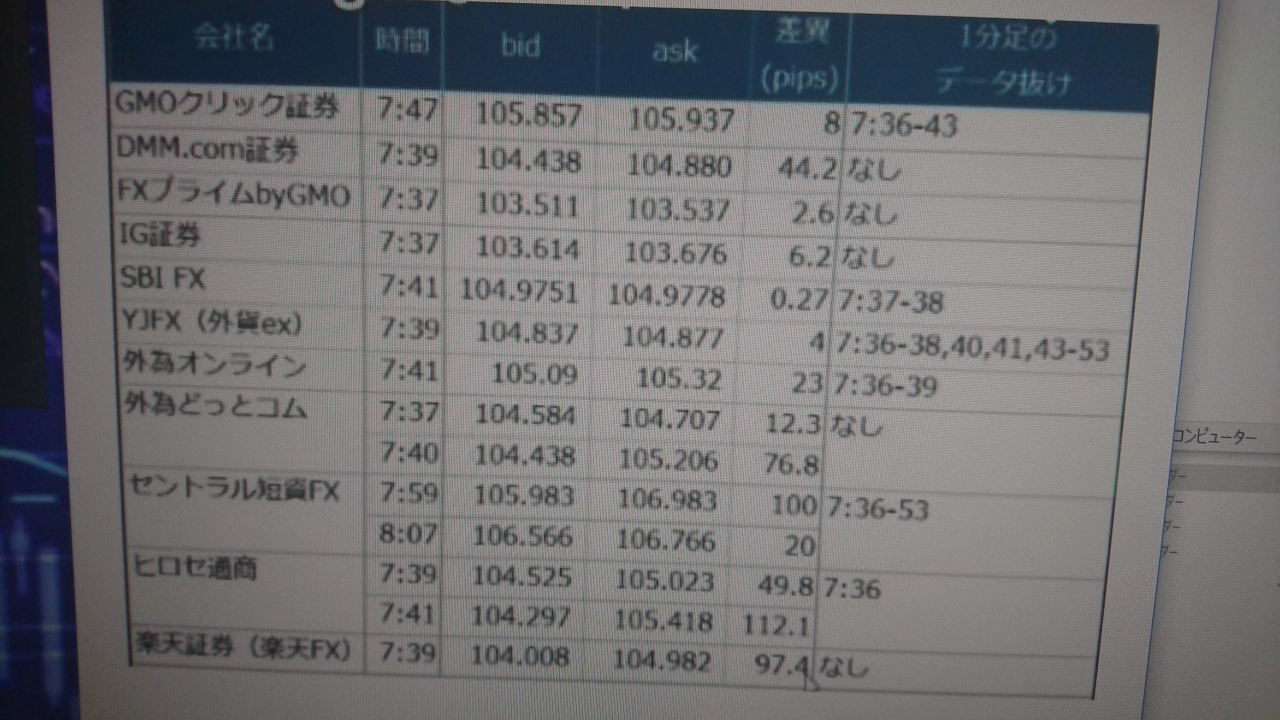
As you can see in the diagram below,
some brokers widened the spread to 100 pips, causing a loss-cut and margin-call frenzy.
Many investors recommend closing positions at year-end for that reason.
Basically, I also try not to hold positions during year-end and New Year, or if I do, I keep positions small as a precaution.
Please keep in mind that something like this can happen!
The era repeats itself, after all…
[Anomaly]
‘Dragon Year peaks in the 10th month, mid-year declines, impatience in early stages, noise in the year of the bird, laughter in the dog, stasis in the boar, prosperity for the rat, stumble for the ox, the tiger runs a thousand miles, the rabbit hops’
is said.
Next year is…‘Mid-year declines’
therefore the market may cool down, but…
In fact, next year’s “Year of the Horse”“ Bing-Wu (Bing-Wu)”is.
Even in a year of the Horse, the year of Bing-Wu can see the market burn hot, but the fire may rise and fall quickly, so the outcome could be a decline after an rise…
That’s the general tendency of that anomaly.
Please remember this as well! (*^^)v
This time we will compare
the so-called “economic temperature”
the “U.S. 10-year Treasury yield”
with it.
【Overall Scenario Probability】
This week’s market as a whole is…
“Up: 45% / Down: 55%”
※Cautious of continuing harmonic downside bias
【This Week’s Market Focus Points】
This week, both the Nikkei 225 and the U.S. 10-year Treasury yield are approaching important milestones.
The U.S. 10-year yield on the weekly chart shows Crab reaching PRZ while there has been no movement toward the TP-Zone (green), making it a phase to search for direction. On the daily chart, Butterfly is forming, showing a short-term rebound and looking for the next move.
The Nikkei 225 on the daily chart shows Gartley’s bullish setup, and it is notable whether the two assets’ correlation will continue to function. In the paid section, we explain in detail the harmonic structures by time frame and points to watch.
➥The rest is explained in detail in a members-only report.
If you are not registered yet, please go here ↓
●Use “The Comprehensive Guide to Bollinger Bands” to analyze charts daily
https://www.gogojungle.co.jp/finance/navi/series/1613?via=articles_detail_aside
●Use “The Prescription of Harmonics” to draw the Zone where the chart should stopZoneas you proceed!https://www.gogojungle.co.jp/finance/navi/series/1668?via=articles_detail_aside
(*From here on, it is for members only.)


