

December 18 (Thu): [Bollinger Bands] Nikkei 225 vs. US 10-Year Treasury Yield
[Note]
What will happen in the year-end and New Year market is unknown.
Trade with some room to spare!
At the beginning of 2019'Flash Crash'occurred.
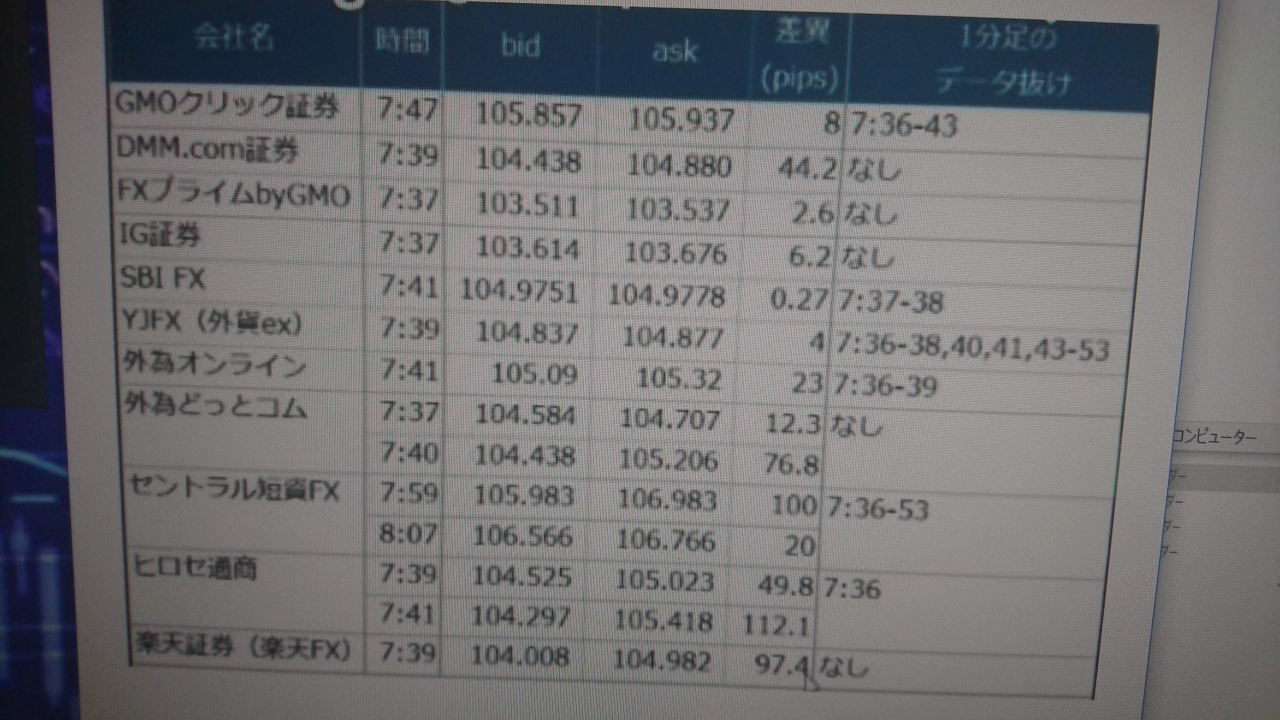
As you can see in the figure below,
some brokers widened the spread to 100 pips, leading to a massacre of forced liquidations and margin calls.
Many investors recommend closing positions at year-end for that reason.
Basically, I also avoid holding positions over year-end and New Year, or if I do, I keep positions small as a precaution.
Please keep in mind that this kind of thing can happen!
History tends to repeat itself, after all...
【Anomaly】
'Tatsumi ceiling,午尻下がり (falling mid-day),未辛抱 (impatience),申酉騒ぐ, 戌笑い, 亥固まる, 子は 繁栄, 丑つまずき, 寅千里を走り、卯は跳ねる'
It is said.
Next year...'午尻下がり'
Therefore the market may lose momentum...
Actually, next year's "Year of the Horse" is"Bing-Wu (Hinowa Uma)".
Even in the Year of the Horse, the market can ignite rapidly, but the ignition may burn out quickly, so a sharp rise followed by a sharp fall is possible, which could end up as '午尻下がり'.
An anomaly that tends to occur in a certain way.
Please memorize this as well! (*^^)v
This time,
it's said to be the temperature of the economy
'U.S. 10-year yield
in comparison.
【Overall Scenario Probability】
This week's overall market is…
"Up: 45% / Down: 55%"
* At a branching point with a slight bias toward the downside
* Provided as a reference level.
【This Week's Market Focus Points】
This week, the market as a whole is at a critical juncture to decide the next direction.
The U.S. 10-year yield is in a weekly closing state, making movement difficult in both directions, building energy for the next move.
Meanwhile, the Nikkei 225 is forming a bullish long lower shadow on the daily chart, showing signs of a reversal. However, if the direction of MA changes with time, there is a possibility of switching to a downside scenario. It will be especially important this week to observe the market without being swayed by short-term movements, using the direction of MA and the battle around ±2σ as axes.
The paid portion continues with a detailed explanation of hour-by-hour specific scenarios.
➥The rest is explained in detail in the members-only report.
If you have not registered yet, please click here ↓
● 'Decoding the Bollinger Bands' to analyze daily charts
https://www.gogojungle.co.jp/finance/navi/series/1613?via=articles_detail_aside
● Use 'Harmonic Prescription' to draw a 'chart should stop at the point of stop' Zoneto illustrate! https://www.gogojungle.co.jp/finance/navi/series/1668?via=articles_detail_aside
(*From here on, it is for members only.)


