

December 17 (Wed): 【Harmonic】 Nikkei 225 vs. USD/JPY
[Notice]
I don’t know what markets will bring at the end of the year and New Year.
Trade with plenty of margin and caution!
At the beginning of 2019'Flash Crash'occurred.
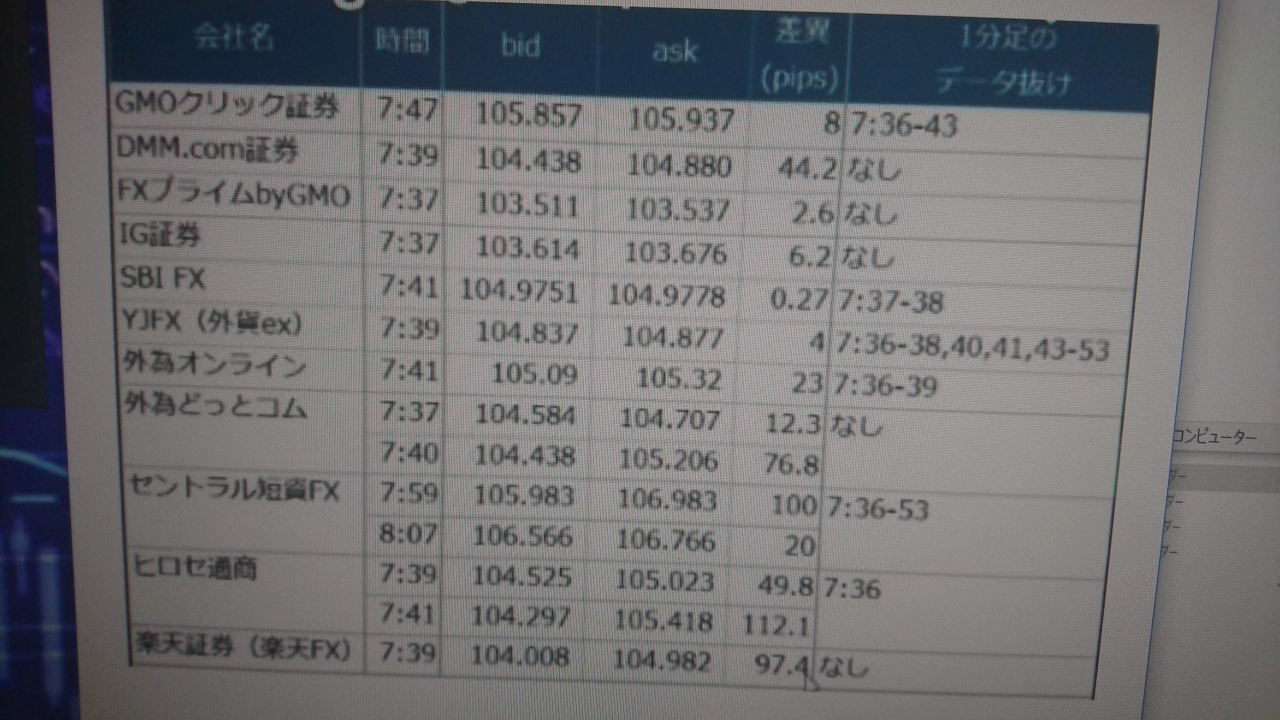
As you can see from the figure below,
some brokers had spreads widen to 100 pips, resulting in a mass of stop-outs and margin calls.
Many investors advise closing positions at year-end for this reason.
Basically, I also aim not to hold positions over the year-end or, if I do, to keep positions small as a precaution.
Please keep in mind that such events can happen!
The times repeat themselves...
[Anomaly]
'Dashi-sen' high, 'Ushi' drop, 'Kino' patience, 'Saruh' noise, 'Inu' laughter, 'I' stiffening, 'Ne' prosperity, 'Ushi' stumbling, 'Tora' running a thousand miles, 'U' jumping'
is often said.
Next year...'Ushi drop'
Therefore there is a possibility that the market may lose steam...
In fact, next year’s “Year of the Horse” is"Bing-youma" (Hinoe-uma).
Even in a Year of the Horse, a year of Bing-youma can see the market surge sharply.
However, even if it surges, it can also cool rapidly, leading to a rapid rise followed by a quick fall, so the outcome could end up as an “Ushi drop” as well...
There is a tendency like that—an anomaly.
Please memorize this as well! (*^^)v
This time
'USD/JPY')
will be compared.
【Overall Scenario Probability】
This week’s overall market is…
"Up: 45% / Down: 55%"
Note: Downward bias is dominant but reversals possible
For reference only.
【This Week’s Market Highlights】
This week, several markets are approaching important “milestones.”
Both the Nikkei 225 and USD/JPY are observing harmonic Gartley patterns on the daily chart, so initial attention is on movements toward the PRZ. However, there may be reversals along the way, so a straight-line movement is hard to expect. In particular, a Butterfly pattern is confirmed on the 4-hour chart for USD/JPY, which could confuse short-term price action.
Overall, it’s a setup where moving lower is possible but not easily advancing, so carefully identifying which time frame leads will be crucial this week.
➥The remainder is explained in detail in the members-only report.
If you are not yet registered, please join from here ↓
● 'Disassembly of Bollinger Bands' to analyze daily charts
https://www.gogojungle.co.jp/finance/navi/series/1613?via=articles_detail_aside
● Use 'Harmonic Prescriptions' to draw 'Chart should stop at the point of stop' ZoneZone!https://www.gogojungle.co.jp/finance/navi/series/1668?via=articles_detail_aside
(*The following content is for members only.)


