

December 16 (Tue): 【Harmonic】 Nikkei 225 VS NASDAQ
[Note]
I’m not sure what will happen in the year-end and New Year market.
Let's trade with some margin for safety!
At the beginning of 2019“Flash Crash”occurred.
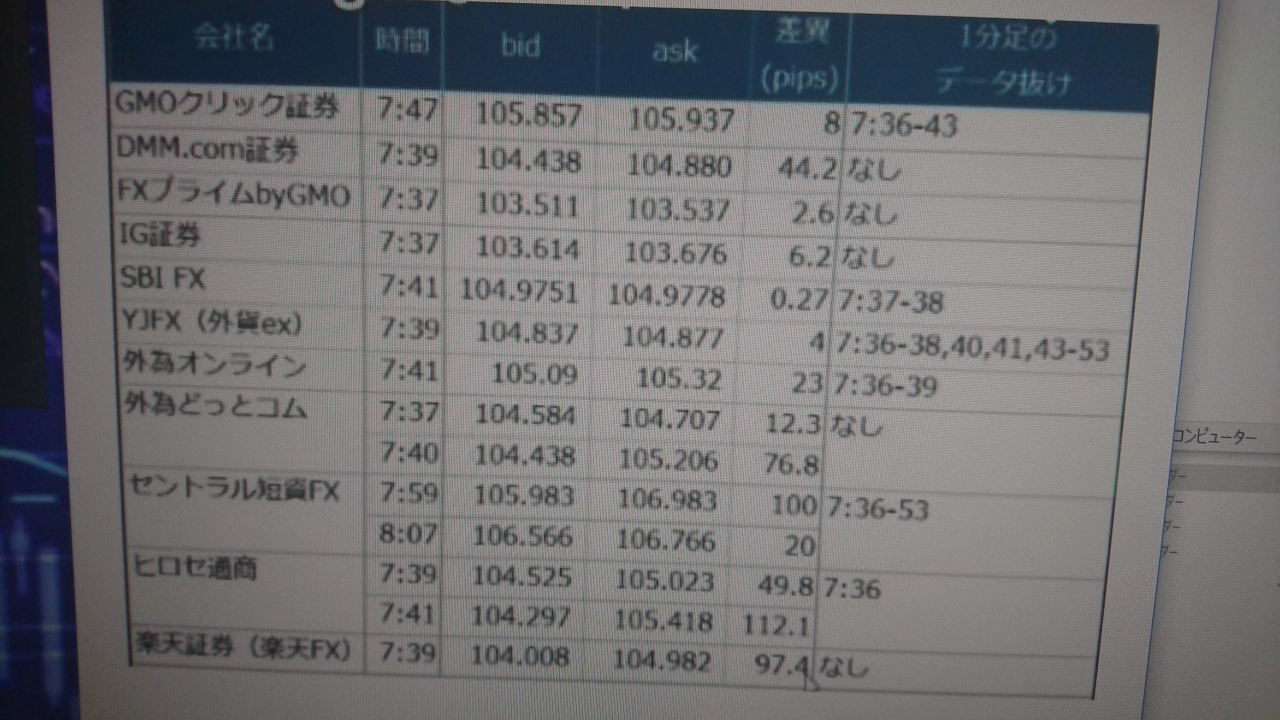
As you can see in the figure below, some brokers had spreads as wide as 100 pips, leading to a massacre of stops and margin calls.
That’s why many investors recommend closing positions at year-end.
Basically, I also avoid holding positions during year-end and New Year, or if I do, I reduce the size of the positions as a countermeasure.
Please keep in mind that this kind of thing can happen!
The era repeats, after all...
[Anomaly]
“Datsumi high, Uma low, Not yet patient, Monkey and Rooster cause a commotion, Dog laughs, Pig hardens, the Year of the Rat prospers, Ox stumbles, Tiger runs a thousand miles, Rabbit jumps”
They say.
Next year…“Uma low”
Thus the market may cool down, but…
In fact, next year’s “Year of the Horse” is“Bing-Wu (Fire Horse)”.
Even in “Horse Year,” the market can burst into flames and rally rapidly, but rapid rises can be followed by sharp declines, so a result of “Uma low” is possible…
That’s the general tendency of the anomaly.
Please remember this as well! (*^^)v
This time we will compare with
“NASDAQ”
.
【Overall Scenario Probability】
This week’s overall market is…
“Up 45% / Down 55%”
Note: considering lower interest rates and stock price adjustments.
Note for reference only.
【This Week’s Market Focus Points】
This week, the Nikkei 225 and NASDAQ stand at a turning point whether they will enter a correction or recover. On the daily chart, the Nikkei 225 shows a provisional Gartley pattern pointing upwards, and whether it will move toward a potential PRZ is a key point of attention.
Also, if NASDAQ declines further, a Butterfly pattern may form downward, and depending on price action, a downwards warning may be necessary.
Furthermore, the U.S. 10-year Treasury yield weekly Crab pattern remains bearish, so pay attention to its correlation with the stock market.
In the paid section, we provide concrete scenarios based on these harmonic structures and explain future probabilities in detail.
➥The continuation is explained in detail in the member-only report.
If you are not registered yet, please register from here ↓
●Use “A Crash Course on Bollinger Bands” to analyze daily charts
https://www.gogojungle.co.jp/finance/navi/series/1613?via=articles_detail_aside
●Use “Harmony Prescriptions” to draw a “zone where charts should stop”Zoneand see how it works!https://www.gogojungle.co.jp/finance/navi/series/1668?via=articles_detail_aside
(The following sections are for members only.)


